India Hotel Industry Statistics: How Big Is the Market?
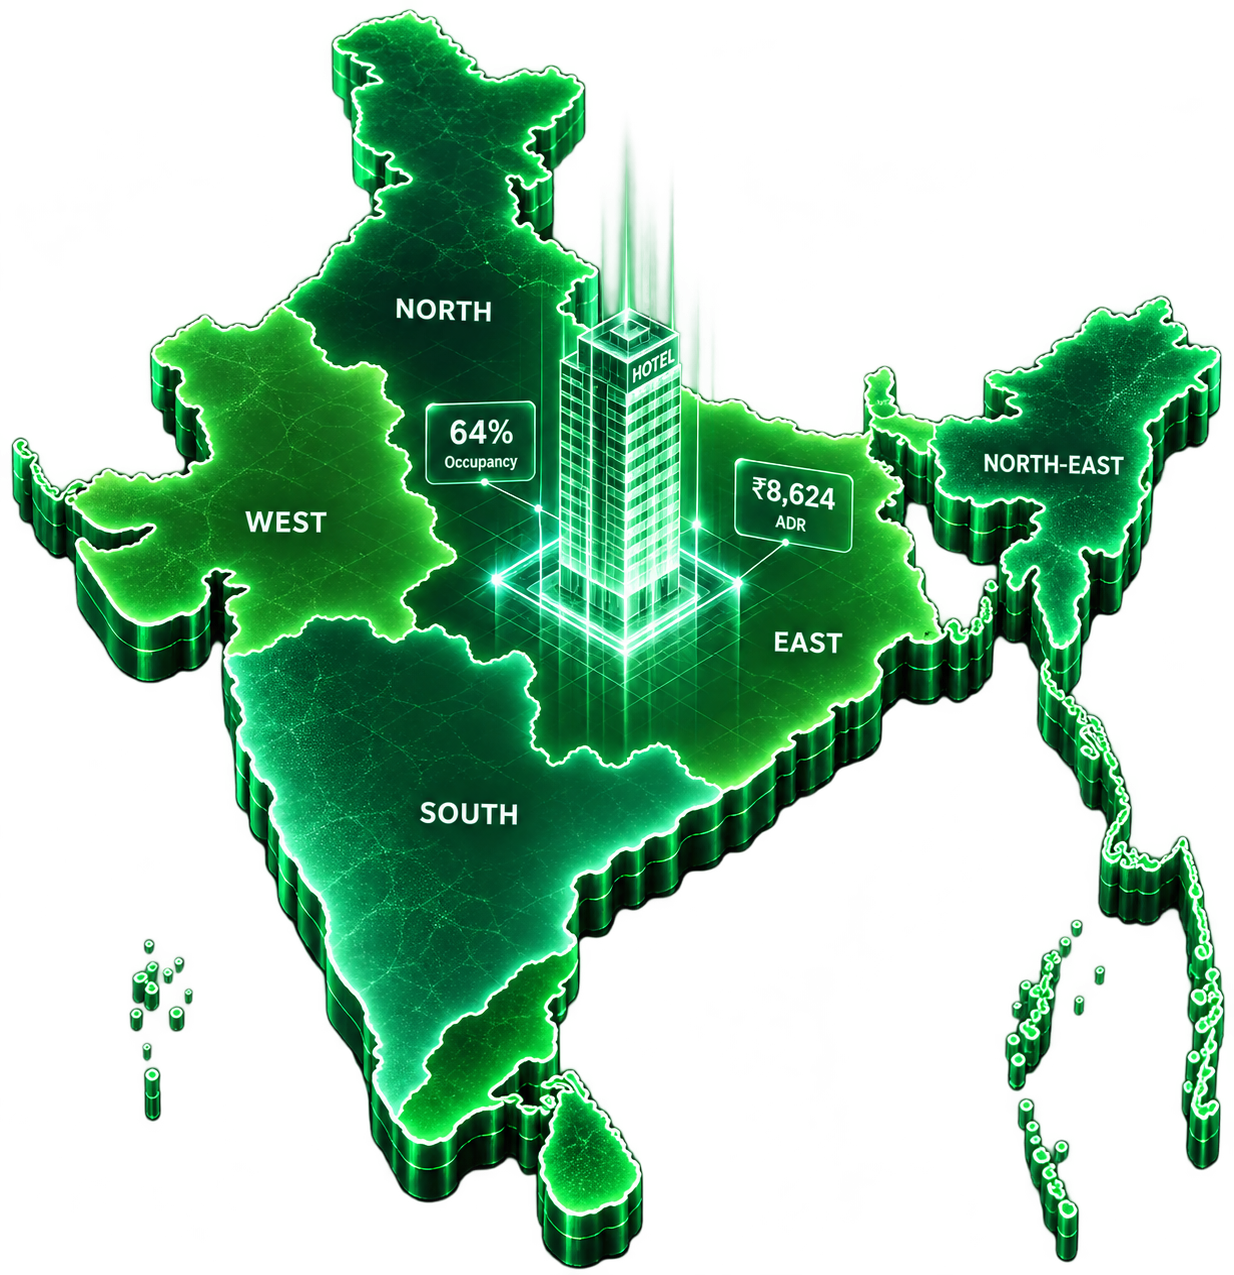
It depends on what is counted. Mordor Intelligence puts India's hospitality market at $27.96 billion in 2026, built around lodging. MarkNtel Advisors puts it at $65.45 billion, because it also counts food and beverage, travel services and entertainment. For a hotelier, the useful physical number is supply: about 216,000 chain-affiliated rooms at the end of 2025, running at 64% occupancy and an ADR of ₹8,624.
Two research firms answer the same question and land more than $37 billion apart. Neither is wrong. They are measuring different things, and a hotel owner benchmarking a 40-room property against the bigger figure is comparing room revenue with somebody else's restaurant, travel desk and entertainment income. The table sets out what each firm says it counts.
| Research firm | 2026 estimate | Forecast | CAGR | What it counts |
|---|---|---|---|---|
| Mordor Intelligence | $27.96B | $55.67B by 2031 | 14.76% | Lodging, split into chain hotels, independent hotels and alternate accommodation, by class and booking channel |
| MarkNtel Advisors | $65.45B | $101.38B by 2032 | 7.57% | Accommodation (about 40% of the total) plus food and beverage, travel and tourism services, entertainment and leisure |
For a single hotel, Mordor's lodging-led estimate is the closer match, and its 14.76% CAGR is the number to hold your own growth against. MarkNtel's is the right figure if the question is how much India spends on hospitality overall. Both come from commercial research firms using their own models, so they show scale and direction, not an audited total.
Horwath HTL and Hotelivate differ because their dates and counting bases differ: Hotelivate's survey base ends in March 2025, Horwath's count runs to the end of calendar 2025 and covers a wider set of chains. The 58% is the pipeline measured against today's supply over the next several years, not a year-on-year growth rate, which is how it often gets quoted.
Hotel Market Structure: Segments and Who Owns India's Rooms
Supply in India is easier to read by price tier than by star category, and the tiers earn very differently. Horwath HTL's 2025 segment figures show how lopsided the revenue is.
| Segment (2025) | Occupancy | ADR | RevPAR | Share of rooms revenue | Share of demand |
|---|---|---|---|---|---|
| Luxury and upper upscale | 68.1% | ₹13,379 | ₹9,110 | 56% | 36% |
| Upscale and upper midscale | 65.9% | ₹6,942 | ₹4,574 | 32% | 39% |
| Midscale and economy | 56.7% | ₹4,049 | ₹2,294 | 12% | 25% |
Luxury and upper-upscale hotels hold about 34% of supply, earn 56% of rooms revenue, and fill best. The midscale and economy tier is the one growing fastest: supply up 11.9% and demand up 17.8% in 2025, with RevPAR up 15.9%. Strip out hotels listed on aggregator platforms and that tier's occupancy, ADR and RevPAR become 64.1%, ₹4,666 and ₹2,988, a more honest picture of the chain-run midscale hotel. Heritage properties, palaces and havelis, sit outside these tiers and are priced on story, which is why Rajasthan reads so differently from everywhere else.
Most Indian hotel rooms are not branded, and a large share is not even listed on an OTA. That's the structural gap behind chains and revenue-management firms pushing into Tier 2 and Tier 3 cities instead of fighting over the same six metros. Hotelivate's proposed-room split is Tier 1 24%, Tier 2 29% and Tier 3 47%, so about 76% of the branded pipeline is aimed at Tier 2 and 3.
India's Five Hospitality Regions
Segment is one lens. Geography is the other, and the regions behave like different countries. Hotelivate's zone data for fiscal 2024/25 shows how far apart they sit on rate, even before anyone looks at what drives the demand underneath.
| Region | Occupancy, FY2024/25 | ADR | What drives demand |
|---|---|---|---|
| North India | 65.8% | ₹9,049 | Four separate engines: pilgrimage volume, heritage weddings, hill-station leisure, Delhi business and MICE |
| West India | 69.5% | ₹8,451 | Mumbai business and conventions, Gujarat commerce, Goa leisure |
| South India | 69.5% | ₹8,151 | IT, GCC and corporate cities, Kerala and hill leisure, Tirupati pilgrimage |
| East India | 65.6% | ₹6,426 | Kolkata business, Puri and Bodh Gaya pilgrimage, Darjeeling and coastal leisure |
| North-East India | Counted with East | Counted with East | A small chain base of about 2.6k rooms, nature and culture led, with a pipeline of 3.5k |
Hotelivate counts the North-East inside its East zone and puts Madhya Pradesh in West, so its zones don't match the five regions on this site exactly. Read the table as a guide to scale, not a ranking. On Horwath HTL's measure the North-East holds about 2.6k chain-affiliated rooms against 216,000 nationally, which is why its growth rate (Mordor expects it to be the fastest-growing region, 16.46% a year to 2031) is a story about a small base. West is the largest region in both Mordor's and MarkNtel's models, at about 30% and 32% of a broad hospitality measure. Of Hotelivate's 114,151 proposed rooms, 42% are in the North, 27% in the West, 21% in the South and 10% in the East.
Every region page on this site splits into clusters, a business hub, a pilgrimage circuit, a leisure belt, because what drives a booking changes by town, not by region. A hotel in Rishikesh and a hotel in Gurugram share a region and almost nothing else. Use the region to understand scale and the cluster to price a room.
Hotel Occupancy, ADR and RevPAR in India: National and City Benchmarks
Look at the last two rows together. Occupancy is where it was in 2019. ADR has risen by about half. The industry's recovery has been a rate story, supply grew more than 40% over the same stretch, and Horwath HTL expects all-India occupancy to hover in the mid to high 60s for several years as that supply fills. That is a very different position from "occupancy and ADR are both climbing", which is how the last two years get described.
| Market (2025) | Occupancy | ADR | Occupancy index | ADR index |
|---|---|---|---|---|
| India (baseline) | 64% | ₹8,624 | 100 | 100 |
| Mumbai | 77.1% | ₹12.3k | 120 | 143 |
| Delhi | 75.3% | ₹11.7k | 118 | 136 |
| Bengaluru | 66.8% | ₹9.6k | 104 | 111 |
| Goa | 65.3% | ₹10.3k | 102 | 119 |
| Jaipur | 65.6% | About ₹9.6k | 103 | 111 |
| Udaipur | 54% | ₹15.9k | 84 | 184 |
| Ahmedabad | 69.9% | ₹5.6k | 109 | 65 |
Index is the market's figure divided by the national figure, times 100. ADR for Bengaluru, Goa and Ahmedabad is as rounded in Horwath HTL's market commentary; Jaipur's is read from the report's chart.
Mumbai and Delhi lead on both measures. Udaipur is the outlier in the other direction: the highest market-wide rate in India on the lowest occupancy of these markets. Ahmedabad fills well and earns the least. Rates rose fastest in the largest markets: across Horwath's top ten markets ADR rose 10.9% and RevPAR 13.1% in 2025, with Chennai's RevPAR up 16.9% and Kochi's up 11.6%. Goa went the other way, its ADR dropping by ₹481.
Horwath HTL counts 144,000 rooms in the pipeline against 216,000 operating. It expects about 300,000 rooms by 2030 rather than the 360,000 on paper, because delivery keeps running behind schedule, but even that would be a 40% jump. A rate plan that assumes today's demand-supply balance holds through 2028 is the one that gets repriced the hard way.

How does your hotel's occupancy and ADR compare with your own market, not India's?
Book a call to see live results from comparable properties in your city. We'll show you what a real comp set is pulling, not a national average.
Book a Call to See Live ResultsWho Is Traveling: Domestic Demand, Weddings and the Maha Kumbh Effect
India's hotel demand is overwhelmingly Indian. The Ministry of Tourism counted 2,948 million domestic tourist visits in 2024 and 4,286.9 million in 2025, a jump of 45.6% that is mostly the Maha Kumbh: Uttar Pradesh alone recorded 155.74 crore visits in 2025 against 64.68 crore the year before. Foreign tourist arrivals moved the other way, from 9.95 million in 2024 to 9.15 million in 2025, a fall of 8.1% and still below 2019.
| Year | Domestic tourist visits | Foreign tourist arrivals |
|---|---|---|
| 2024 | 2,948 million (+17.5%) | 9.95 million (+4.5%) |
| 2025 | 4,286.9 million (+45.6%) | 9.15 million (-8.1%) |
Horwath HTL is blunt about what the Kumbh did to everyone else: it took travel away from leisure markets as the country's attention went to Prayagraj, and business travel took a hit too. Operation Sindoor, West Asia disruption, harsh weather and the IndiGo duty-time limits did further damage. The hills lost business, Rajasthan saw flood disruption, and Varanasi's ghats went under water. A headline of record visits can sit beside a soft year for the hotel next door.
The tourism compendium counts visits, not paid room nights. Much of a record pilgrimage count never touches a hotel: it stays in dharamshalas, ashrams and with relatives, or goes home the same day. The number tells you where people are heading. How many of them become your guests is a separate question.
Weddings are the other big domestic engine. CAIT, the traders' body, forecast 46 lakh weddings and about ₹6.5 lakh crore of business for its 2025 season (1 November to 14 December), against 48 lakh weddings and ₹5.9 lakh crore the season before. Those are survey-based pre-season trade forecasts across all wedding spending, not hotel revenue, but they explain why destination-wedding markets like Udaipur and Jaipur price on a calendar of their own.
Seasonal Demand Patterns in India's Hotel Industry
None of the national averages above hold steady through the year. India's demand moves in sharp swings tied to weddings, festivals and pilgrimage dates, and a flat rate across twelve months is one of the commonest ways an independent hotel leaves money on the table.
| Season | Roughly when | What's driving it | What we see on managed properties |
|---|---|---|---|
| Wedding season | November to February, a smaller window in spring | Destination weddings, family functions, muhurat dates | Large occupancy lifts and rate premiums in wedding-capable markets |
| Festival peaks | October to November (Diwali, Dussehra), August to September (Ganesh Chaturthi, Onam) | Domestic travel, family visits, observance | Sharp short spikes, strongest in leisure and pilgrimage markets |
| Pilgrimage circuits | Varies: Char Dham April to November, Kartik Purnima, Kumbh cycles | Religious tourism | Budget and midscale demand can run several times normal in temple towns on peak dates |
| Summer leisure | April to June | School holidays, hill-station travel | Hill destinations peak while metro business travel softens |
| Monsoon low season | July to September, except where the monsoon is itself a draw | Reduced leisure travel | Occupancy dips outside corporate and MICE segments |
| Winter peak | November to February | Weather, conferences, weddings, year-end travel | The strongest quarter for most regions, less pronounced in the South |
A hotel in Rishikesh and a hotel in Goa both count as leisure properties and read completely different calendars. Char Dham season drives Rishikesh from April to November. Goa peaks in winter and goes quiet in the monsoon. Pull a generic seasonality template off the internet and you price against the wrong curve, which has cost properties we've worked with a whole festival weekend's premium rate.
Online vs. Offline: How Hotel Bookings Actually Happen in India
None of that seasonality matters if a guest can't find your listing, and how they find it is shifting. The most-quoted figures date from the CRISIL MI&A study of the travel industry, published in August 2023, so they describe fiscal 2023, not today.
"66 to 68% of India's travel bookings are online" and "31 to 33% of hotel bookings are online" are both true. The first is blended travel: flights, trains, buses and hotels together. Hotels lag far behind, largely because so much unbranded supply is never listed online at all. CRISIL forecast hotels reaching 38 to 40% by fiscal 2028 and travel overall reaching 73 to 75%. Mix the two up in a pitch deck and someone will catch it.
The two OTA shares don't conflict. CRISIL measures OTAs against online hotel bookings only. Mordor measures third-party portals against a wider accommodation market that includes vacation rentals and hostels. Mordor also reports that commissions have climbed from the 15 to 18% range toward 40 to 45% at the top end, and that MakeMyTrip's rate was capped near 22% after hotel associations threatened a boycott; treat that as one firm's account rather than a published tariff. Skift Research found MakeMyTrip in 52% of Google Hotels sponsored listings in January 2025, which measures search presence, not market share.
Listed Hotel Chains: What Their Margins Say About the Next Three Years
India's listed chains are the clearest public read on how the good years are being converted into profit, and the answer is: at margins that rarely last.
| Company (fiscal year to March 2026) | Revenue | Margin |
|---|---|---|
| IHCL (Taj Group), consolidated | ₹9,971 crore (+16%) | 34.9% EBITDA |
| Lemon Tree Hotels | ₹1,452.7 crore (+13%) | 48.1% net EBITDA, after lease rentals |
| Chalet Hotels | ₹2,070 crore of revenue (ex-residential) | 46.2% ex-residential, 43.7% as reported |
Lemon Tree's margin is struck after lease rentals, a different definition from IHCL's and Chalet's, so the three are not directly comparable. Across the listed sector Horwath HTL puts the EBITDA margin at 38% for fiscal 2025 and 34% for the first half of fiscal 2026, and notes that India-listed companies own or manage about 45% of chain inventory. Margins in the mid-thirties and above are the reward for a stretch in which rate rose faster than occupancy. Owners betting on them holding as 144,000 rooms arrive are betting against the pipeline.
For Independent & Boutique Hotels
The margins above belong to chains. Most people reading a page like this don't run a Taj. They run a 20 to 60 room independent property, or a boutique place their family has owned for two generations, and the market data above is least kind to them.
Independents hold most of the rooms but a minority of online bookings, and the branded supply is now heading straight for their cities. That is the pressure behind the pricing, distribution and reputation work in MMR's guides. A property that gets its channel mix, comp set and calendar right before a chain opens down the road is in a much better position than one that reacts afterward.
We'd start with the comp set, because "the market" in a benchmark report is a chain-heavy average and an independent should be measured against the five or six hotels guests actually compare it with. Then we'd look at channel mix: what share of room nights comes from OTAs, what share direct, and what each costs after commission. We'd build the rate calendar around the local demand curve, not a national one. And we'd plan now for the branded hotel that is likely to open within a few kilometers in the next three years, since that is the event most likely to reset the local rate.
Why MMR Hotels
All of this points the same way for hotel owners: the market is moving quickly, and the properties that win manage pricing, distribution and reputation as a discipline, not an afterthought squeezed between shifts. That's the gap MMR Hotels was built to close, and we'd rather show it with numbers than assert it.
A lot of revenue-management software is built for the US or Europe and bolted onto India afterward. Festival demand curves, OTA ranking behavior on MakeMyTrip and Goibibo, and travel patterns that shift the week a wedding season or pilgrimage calendar begins don't transfer cleanly from a generic playbook. MMR started in Bhopal in 2018 with two hotels, building for exactly this market, and we do the implementation week over week rather than handing over a quarterly PDF.
Where does your property actually sit against these numbers?
We'll benchmark your pricing, OTA performance and direct booking ratio against your real comp set, not a national average, within 48 hours, at no cost.
Book Free Revenue AuditOccupancy, ADR, RevPAR, segment, supply and pipeline figures for calendar 2025 come from Horwath HTL's India Hotel Market Review 2025 (February 2026, CoStar data), and the 2019 comparison and 2024 figures from the same series. Hotelivate's 2025 Indian Hospitality Trends and Opportunities (October 2025, fiscal 2024/25) supplies the 196,464-room survey base, the 114,151-room pipeline, the zone figures and the tier split, and its Sizing Up Indian Hospitality article (September 2024) the 2.48 million lodging rooms and the 68% unbranded share. The market-size estimates are Mordor Intelligence's and MarkNtel Advisors' published 2026 editions. Online-booking shares are CRISIL MI&A (August 2023) and Mordor Intelligence's India Online Accommodation Market; the Google Hotels figure is Skift Research (January 2025). Tourism volumes are the Ministry of Tourism's India Tourism Data Compendium 2025 for 2024 and the Ministry's India Tourism Data dashboard for 2025 (domestic visits, foreign arrivals and Uttar Pradesh), which is a beta release and may be revised. The wedding figures are CAIT's survey-based estimates. Company results are from IHCL, Lemon Tree Hotels and Chalet Hotels investor releases for fiscal 2026. Indices and premiums are our own arithmetic. The seasonal effects in the calendar table reflect our own operating experience, and MMR portfolio figures (843+ hotels, ₹452+ crore optimized, +36% average uplift, 2,243+ audits) are MMR's own, not third-party research.
All Guides in This Pillar
Each guide covers a specific area in depth. Start with the ones most relevant to your current situation.