India Hotel Industry Statistics: How Big Is the Market?
Market-size estimates are named and compared directly in the table below (Mordor Intelligence, MarkNtel Advisors, Research and Markets). Occupancy, ADR and RevPAR benchmarks come from HVS ANAROCK's India Hospitality Industry Overview 2025. Room counts and the organized-vs-unorganized split come from Hotelivate's Sizing Up Indian Hospitality report. Portfolio-specific figures (843+ hotels managed, ₹452+ crore optimized, 36% average uplift) are MMR Hotel Benchmarking Data, drawn directly from MMR's own managed properties, not third-party research.
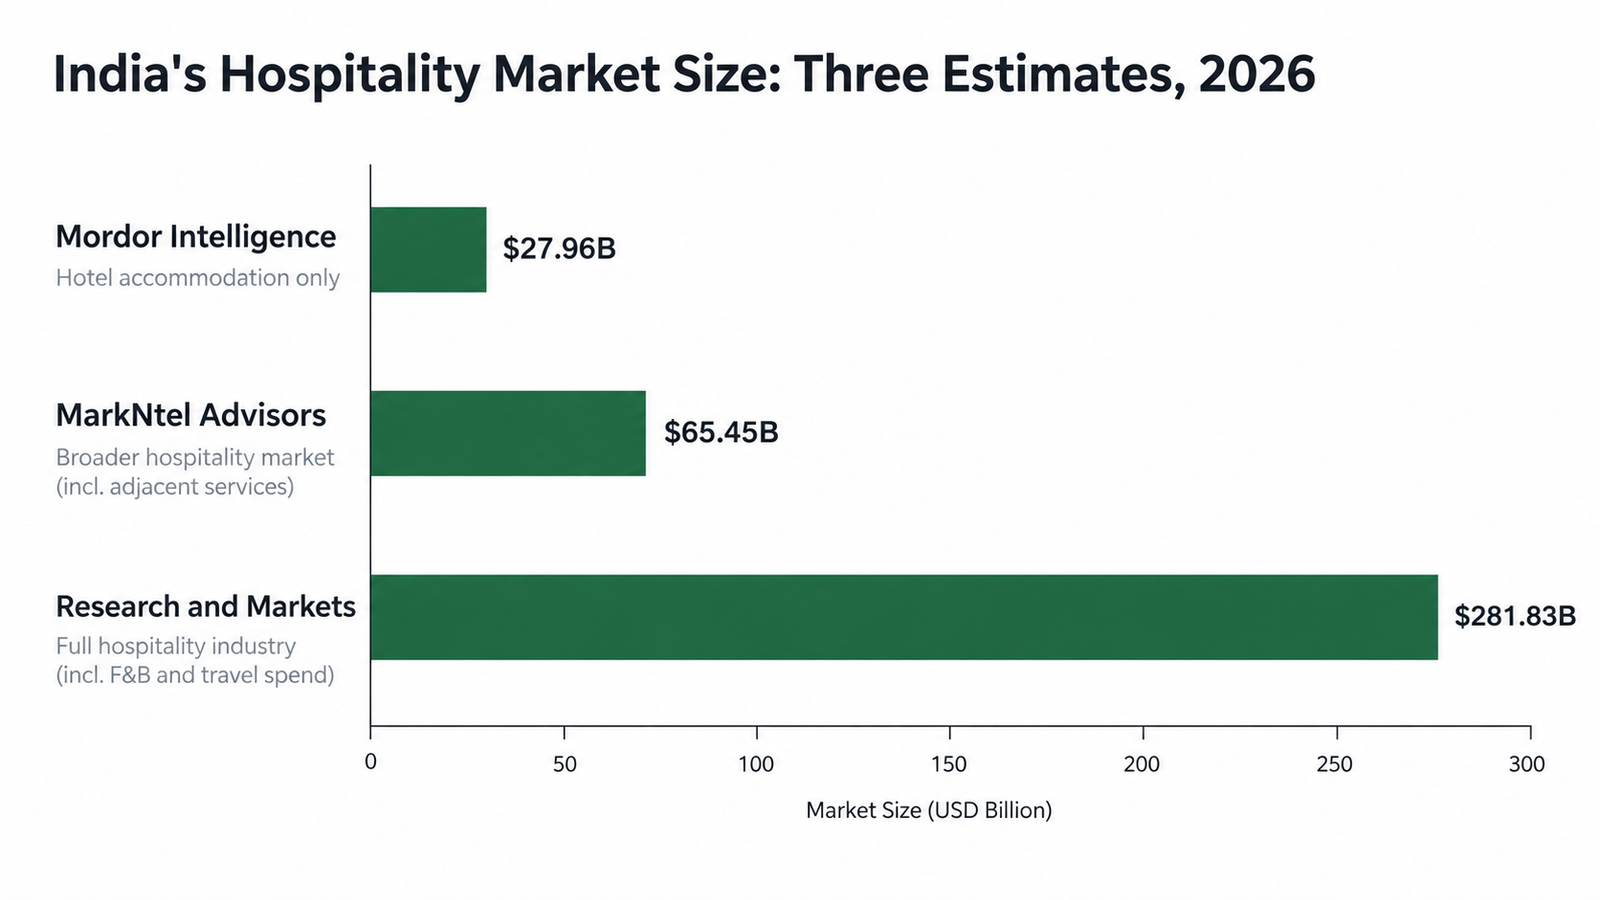
Depends who you ask, and by how much varies more than you'd expect from a market this closely watched. Three research firms currently covering India's hospitality sector put 2026's market size anywhere from $28 billion to $282 billion, not a typo, and each number is legitimate once you know what it's actually counting. Rather than pick one and hope it holds up, here's what each firm actually says.
| Research firm | 2026 estimate | Forecast | CAGR | What it's scoping |
|---|---|---|---|---|
| Mordor Intelligence | $27.96B | $55.67B by 2031 | 14.76% | Hotel accommodation market specifically, rooms revenue |
| MarkNtel Advisors | $65.45B | $101.38B by 2032 | 7.57% | Broader hospitality market, rooms plus adjacent hotel services |
| Research and Markets | $281.83B (2025 base year) | $541.70B by 2030 | 13.96% | Widest scope, full hospitality industry including F&B and broader travel spend |
For a hotelier, the Mordor Intelligence figure is the one that actually applies. It's scoped to hotel accommodation specifically, the branded hotel sector alone runs 196,464 rooms across 2,008 properties in 337 cities, and its 14.76% CAGR is the number worth pricing your own growth expectations against. The larger figures aren't wrong, they're answering a bigger question, how much India spends on hospitality overall, food and beverage and events included, not what a single room is worth. Benchmark your own property's growth against the $65 billion or $282 billion figures and you're comparing your room revenue to somebody else's restaurant and banquet-hall income, numbers that were never yours to chase in the first place.
Hotel Market Structure: Segments & Ownership
Sticking with Mordor Intelligence's $27.96 billion hotel-accommodation figure, the one that actually applies to a single property, that breaks down two ways worth knowing before anything else: by price segment, and by who actually owns the rooms.
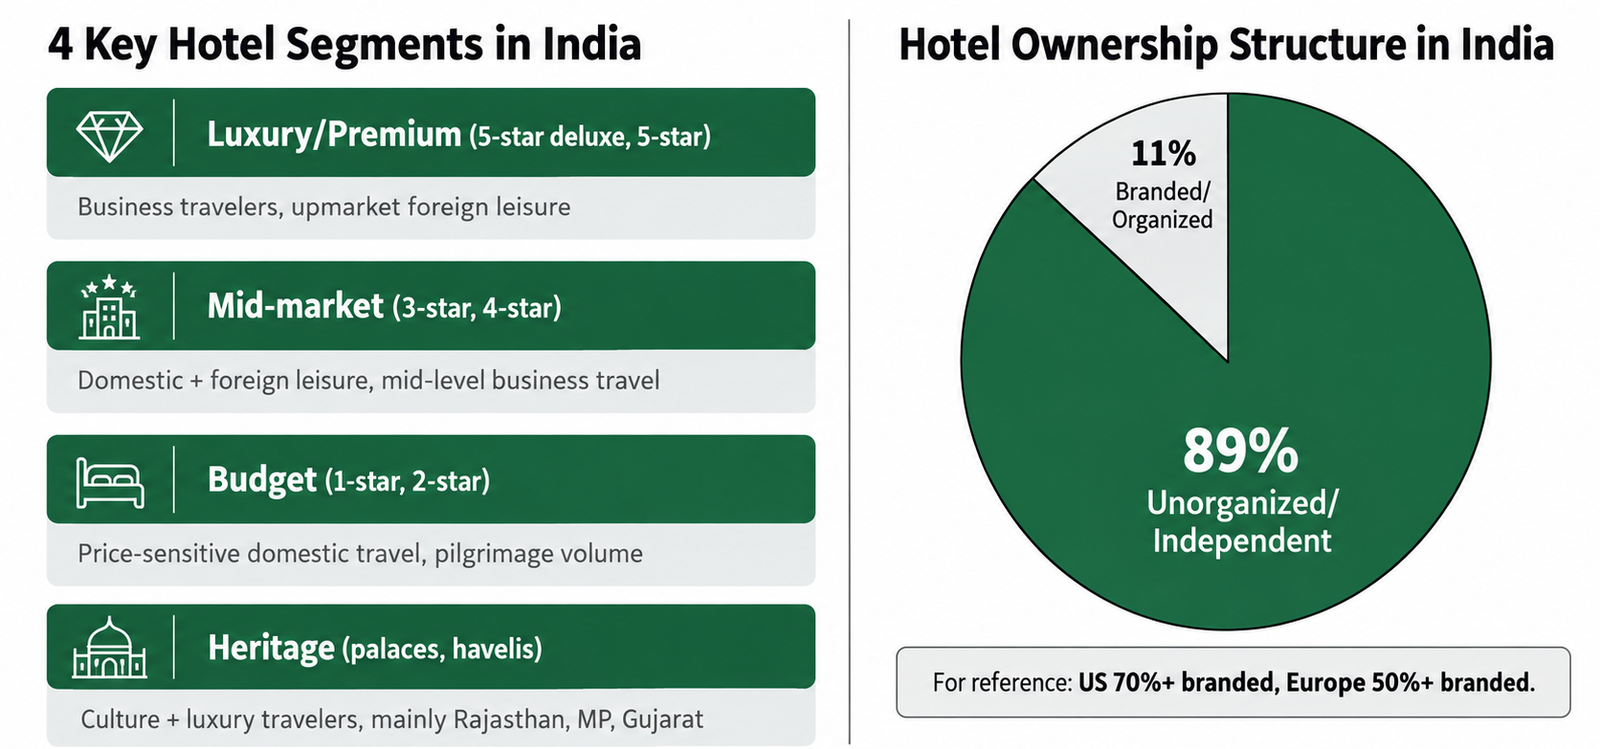
India's Hotel Segments, by Price Category
| Segment | Star category | Who it serves |
|---|---|---|
| Luxury / Premium | 5-star deluxe, 5-star | Business travelers, upmarket foreign leisure |
| Mid-market | 3-star, 4-star | Domestic + foreign leisure, mid-level business travel |
| Budget | 1-star, 2-star | Price-sensitive domestic travel, pilgrimage volume |
| Heritage | Separate category (palaces, havelis) | Culture + luxury travelers, mainly Rajasthan, MP, Gujarat |
Branded vs. Independent: Who Owns India's Hotel Rooms
This is the single biggest structural gap between India and a market like the US or most of Europe. It's also why chains and revenue-management firms, us included, keep pushing into Tier 2 to 4 cities instead of fighting over the same six metros. There's a lot of unbranded supply out there still waiting to be formalized.
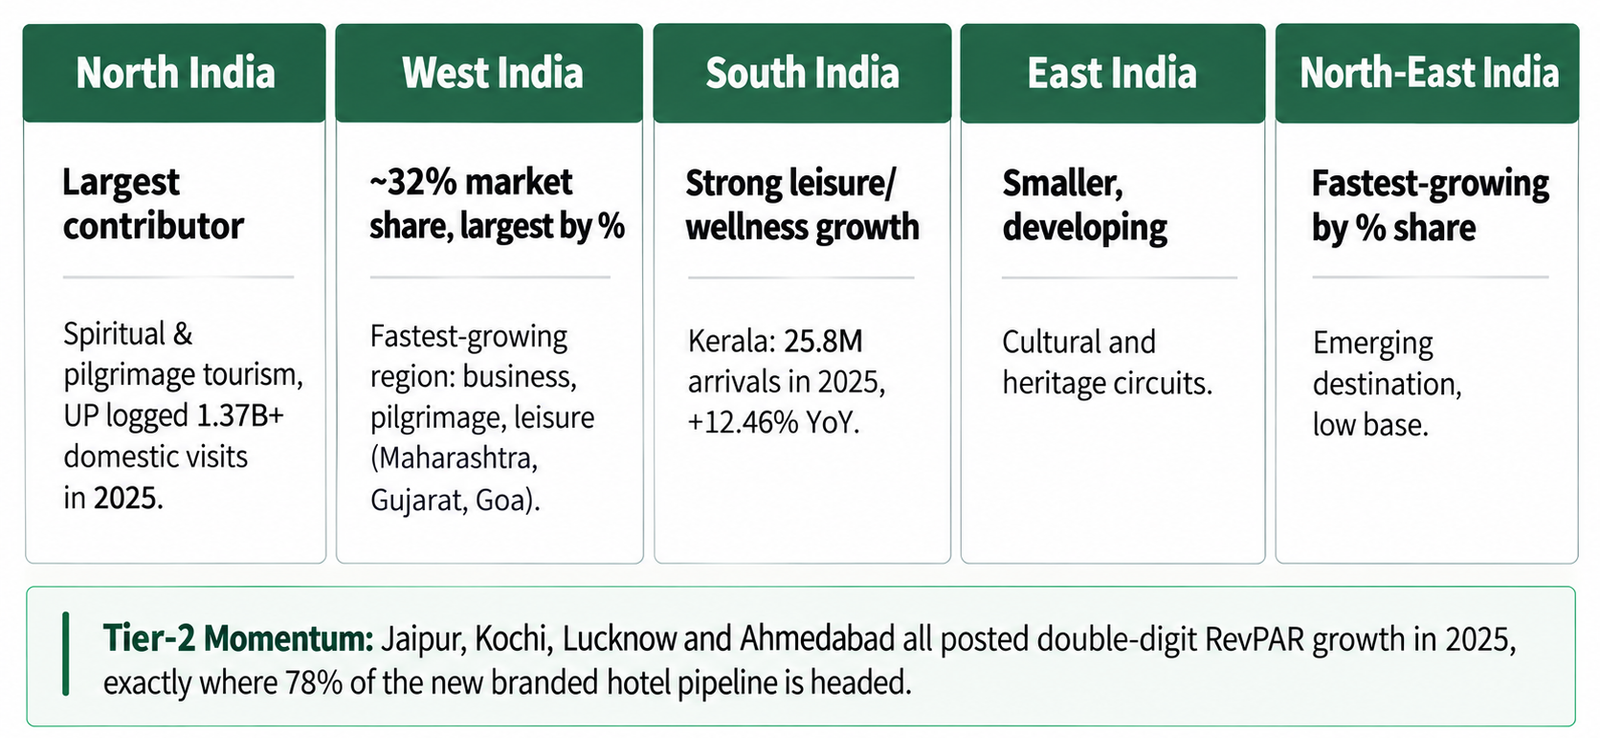
India's 5 Hospitality Regions
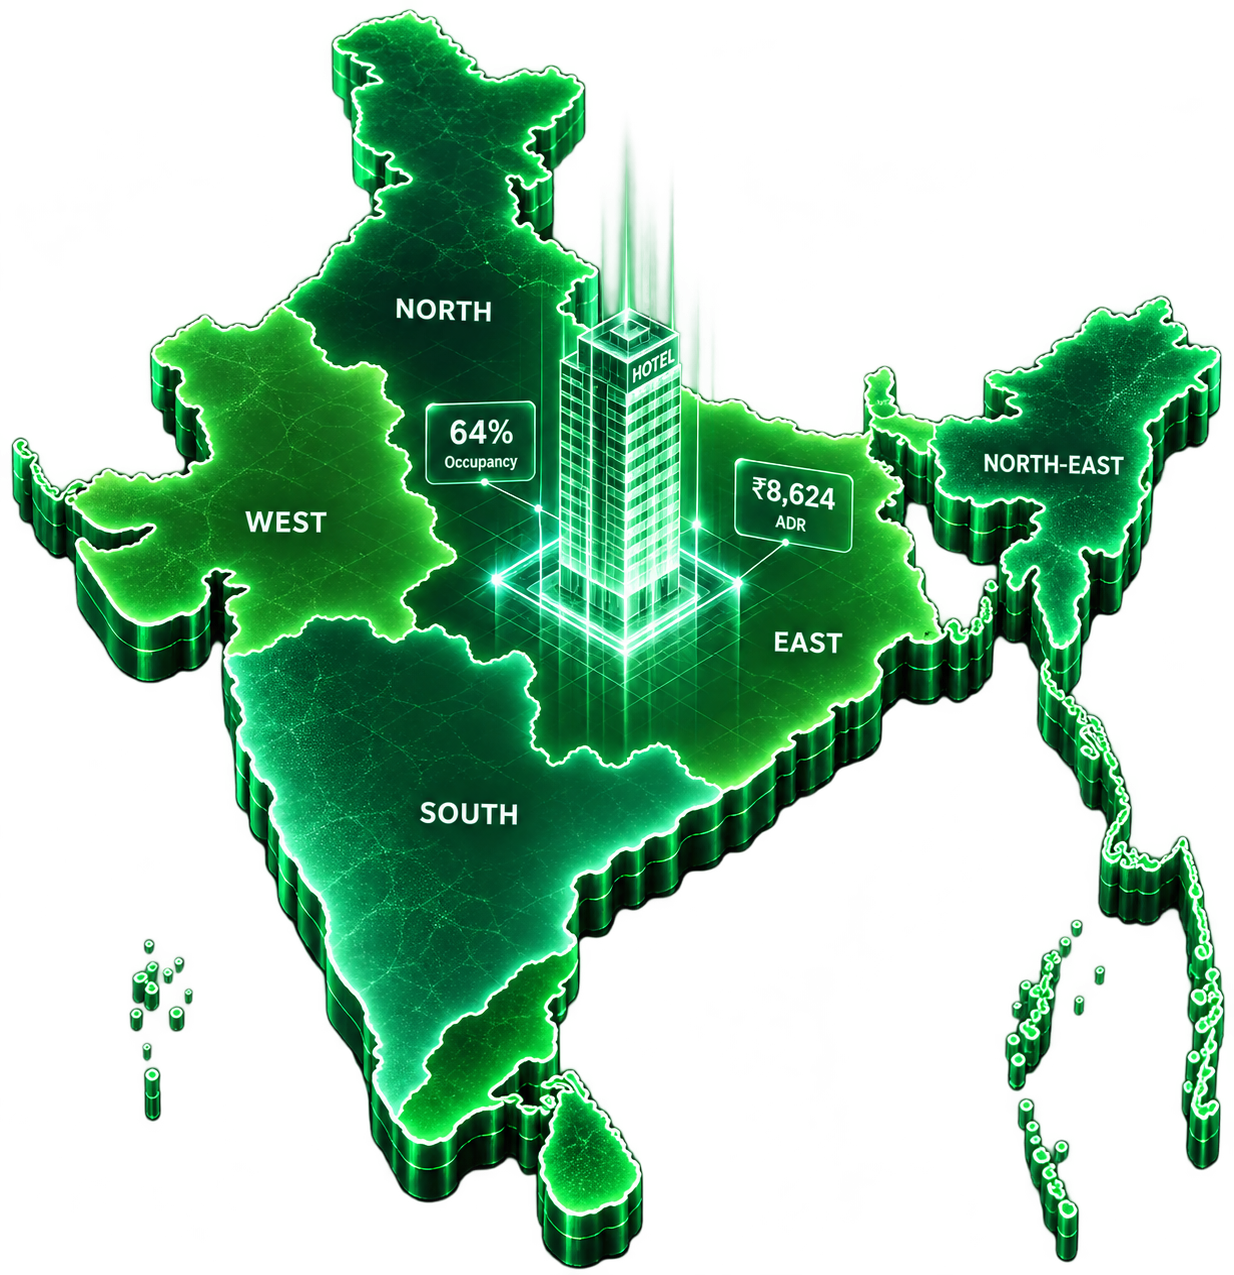
Segment is one lens on this market. Geography is the other, and it matters just as much: hospitality demand in India splits into five regions, each with a distinct driver.
| Region | Market share | Defining driver |
|---|---|---|
| North India | Largest contributor | Spiritual/pilgrimage tourism, UP alone logged 1.37B+ domestic visits in 2025 |
| West India | ~32% (largest by %) | Fastest-growing region; business, pilgrimage, leisure (Maharashtra, Gujarat, Goa) |
| South India | Strong leisure/wellness growth | Kerala: 25.8M arrivals in 2025, +12.46% YoY |
| East India | Smaller, developing | Cultural and heritage circuits |
| North-East India | Fastest-growing by % share | Emerging destination, low base |
Jaipur, Kochi, Lucknow and Ahmedabad all posted double-digit RevPAR growth in 2025. Off a much lower base than the metros, sure. But that's exactly where 78% of the new branded pipeline is headed, so it's worth watching if your property sits anywhere near one of these.
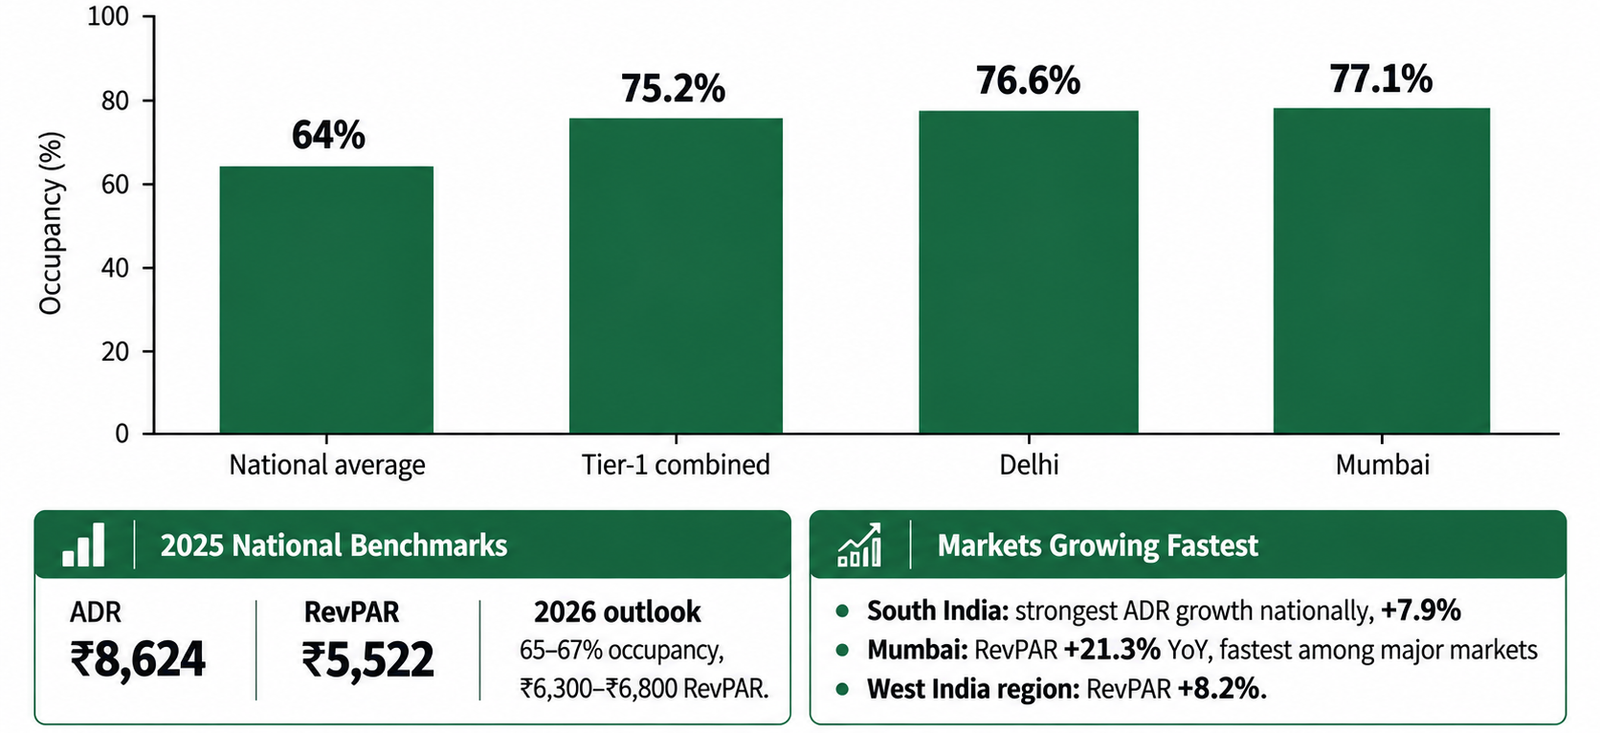
Hotel Occupancy Rate & RevPAR in India, 2026
Segment, region and ownership all roll up into the same numbers hotels are actually judged on.
India's National Hotel Occupancy, ADR & RevPAR Benchmarks
City-by-City Hotel ADR & Occupancy Index
| Market | Occupancy Index | ADR (exact or floor) | ADR Index |
|---|---|---|---|
| National (baseline) | 100 | ₹8,624 (exact) | 100 |
| Mumbai | 120 | ₹10,000+ (floor) | 116+ (floor) |
| Delhi | 120 | ₹8,500+ (floor) | 99+ (floor) |
Index = market value ÷ national average × 100, on MMR Hotel Benchmarking Data. National = 100 baseline; above 100 means that market is outperforming the national average. "Floor" means the underlying figure is reported as "exceeding ₹X," not an exact number, so treat Mumbai and Delhi's ADR and ADR Index as a minimum, the real figure could be higher.
Which Indian Hotel Markets Are Growing Fastest Right Now
| Region | What's moving |
|---|---|
| South India | Strongest ADR growth nationally: +7.9% |
| Mumbai | RevPAR +21.3% YoY, the fastest among major markets, driven by events and MICE/convention business |
| West India (region) | RevPAR +8.2%, with Mumbai leading the region's convention-driven growth |
| Goa | Showing signs of leisure-demand fatigue |
Occupancy, ADR and RevPAR are all climbing together right now, which doesn't happen often. Usually one comes at the expense of the other. Owners are getting fuller rooms and higher rates at the same time, and that window tends to close once new supply actually lands. So 2026 into maybe early 2028 is probably the stretch to make the most of it.
For the formulas behind ADR, RevPAR and the rest, and how to actually act on them, see MMR's full guides: ADR, RevPAR, TRevPAR, GOPPAR and NRevPAR.
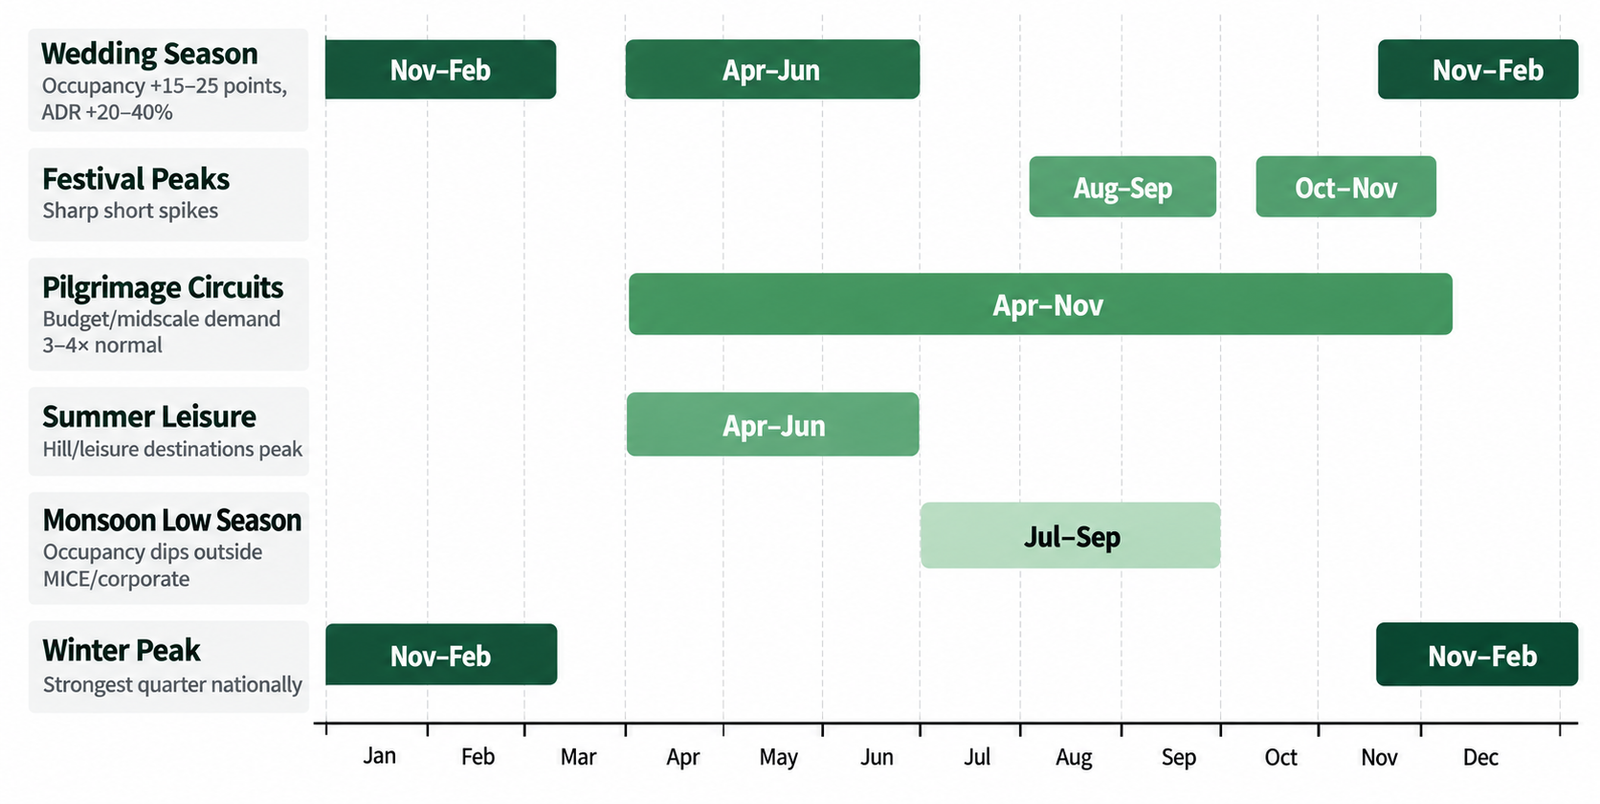
Seasonal Demand Patterns in India's Hotel Industry
None of the national averages above hold steady through the year. India's demand calendar moves in sharp, predictable swings tied to weddings, festivals and pilgrimage dates, and pricing flat across all twelve months is one of the more common ways independent hotels leave money on the table.
| Season | Roughly when | What's driving it | Typical impact |
|---|---|---|---|
| Wedding season | Nov–Feb, plus a smaller Apr–Jun window | Destination weddings, family functions, muhurat dates | Occupancy up 15–25 points in wedding-capable markets, ADR premiums of 20–40% |
| Festival peaks | Oct–Nov (Diwali, Dussehra), Aug–Sep (Ganesh Chaturthi, Onam) | Domestic travel, family visits, religious observance | Sharp short spikes, strongest in leisure and pilgrimage markets |
| Pilgrimage circuits | Varies: Char Dham Apr–Nov, Kartik Purnima, Kumbh cycles | Religious tourism | Budget and midscale demand can run 3–4x normal in temple towns during peak dates |
| Summer leisure | Apr–Jun | School holidays, hill station travel | Hill and leisure destinations peak while metro business travel softens |
| Monsoon low season | Jul–Sep (except the Northeast, where monsoon is itself a draw) | Reduced leisure travel nationally | Occupancy dips outside MICE and corporate segments, which hold up better |
| Winter peak | Nov–Feb | Weather, conferences, weddings, year-end travel | Strongest quarter nationally for most regions, South India less pronounced |
A hotel in Rishikesh and a hotel in Goa are reading two completely different calendars even though they're both "leisure" properties. Char Dham season drives Rishikesh from April through November. Goa peaks in winter and goes quiet in monsoon. Pull a generic seasonality template off the internet and you'll price against the wrong curve entirely, which is a mistake I've seen cost a property an entire festival weekend's worth of premium rate. That local calendar is exactly what's underneath the chain-level numbers coming up next.
Online vs. Offline: How Hotel Bookings Actually Happen in India
None of that seasonal swing matters if a guest can't find the listing to book it in the first place, and how they're finding it is shifting fast.
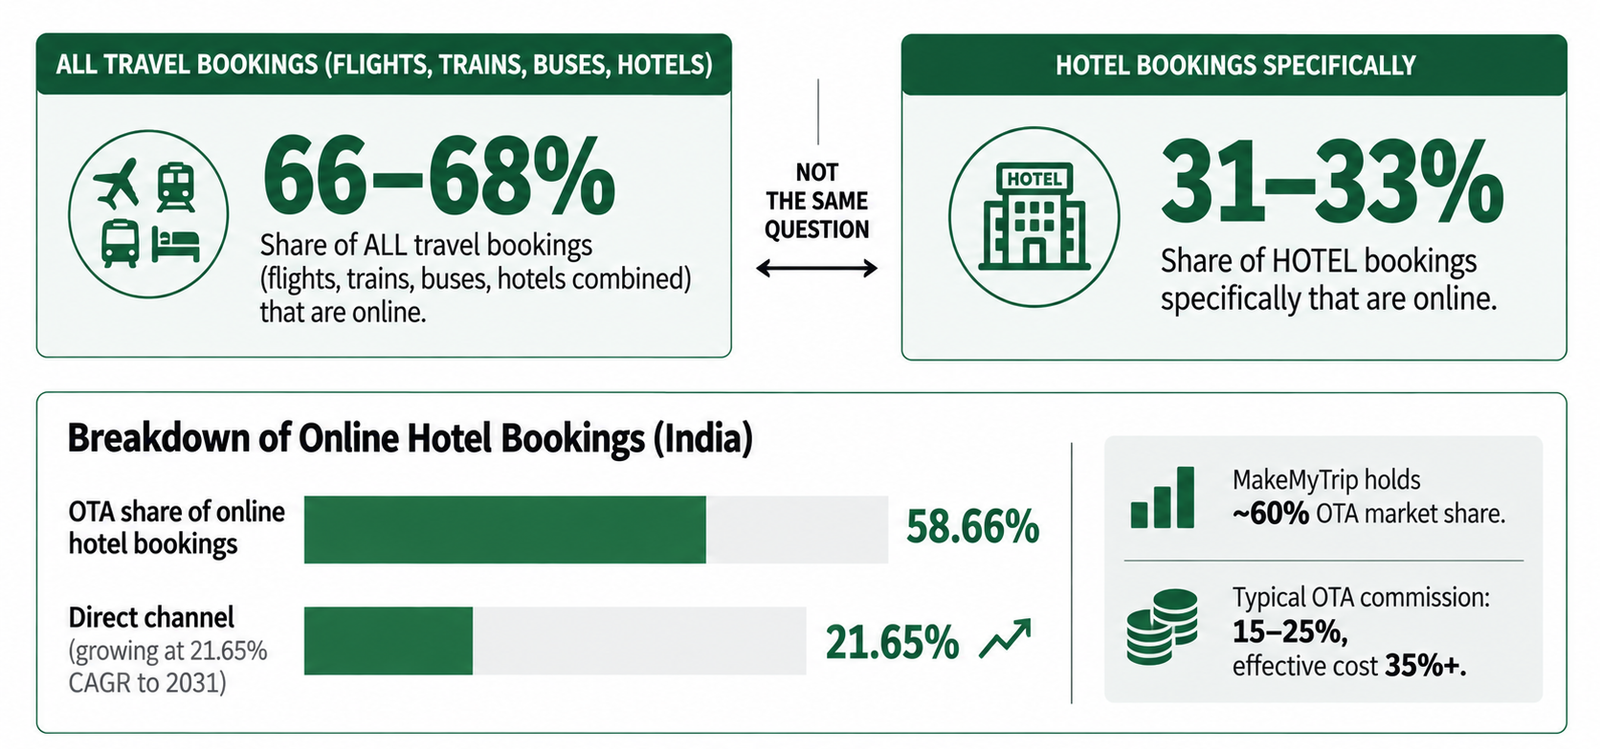
"66 to 68% of India's travel bookings are online" and "hotel booking is 31 to 33% online" are both true at the same time. They're just measuring different things. The first number is blended travel: flights, trains, buses, hotels, all lumped together. Hotels specifically lag way behind that, mostly because most of the unorganized 89% of rooms are never listed online in the first place. Mix the two up in a pitch deck and someone will catch it.

For the full mechanics of OTA commissions, rate parity and channel management, see our OTA Distribution Strategy guide.
For Independent & Boutique Hotels
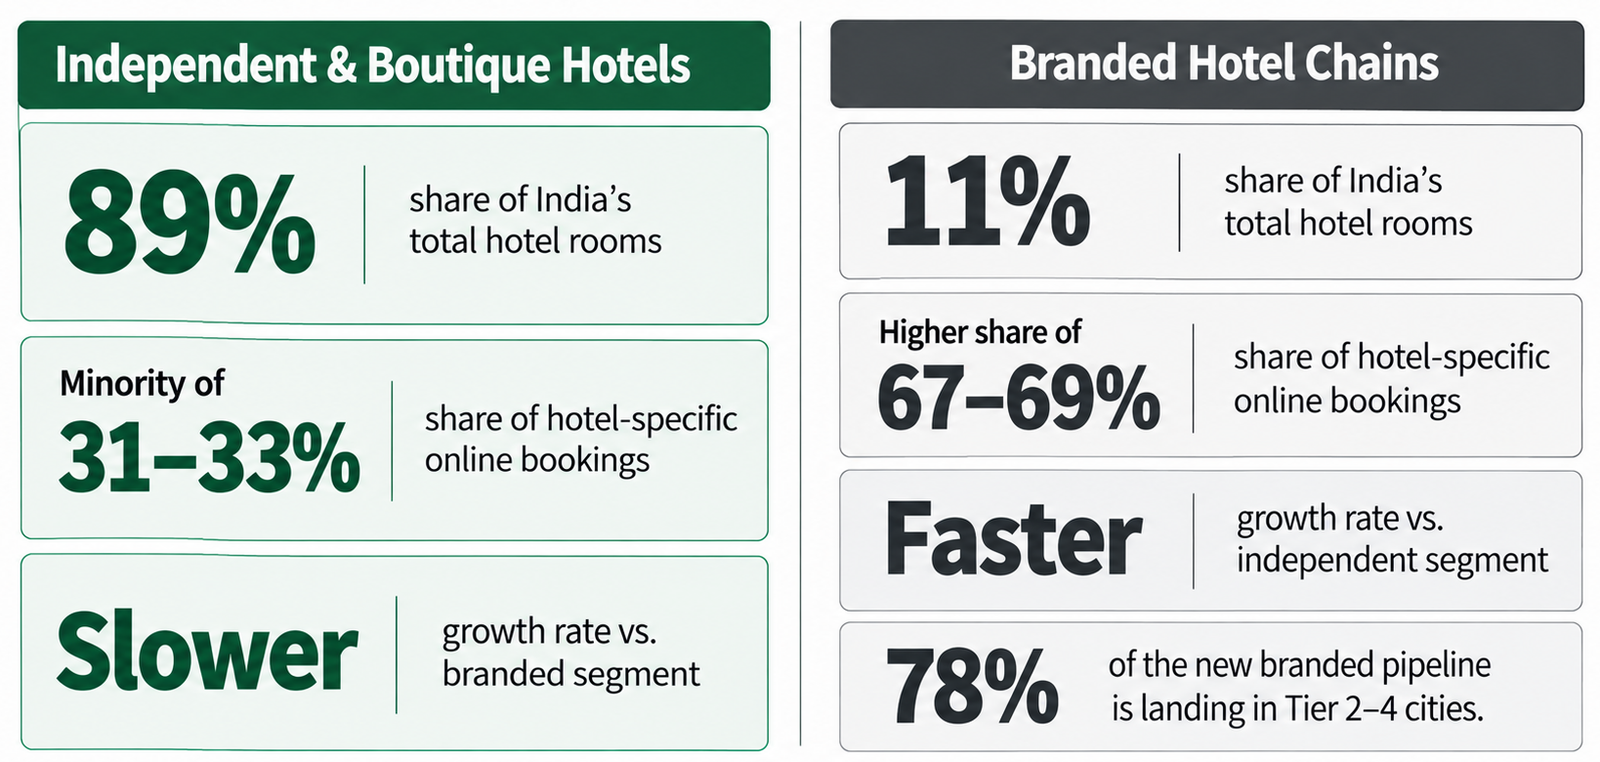
That channel math hits nobody harder than independent and boutique operators, since they're most of who these percentages are actually about. Here's the part that matters most for most readers of this page. Since roughly 89% of India's hotel rooms sit outside the branded, organized segment, most people reading a page like this one aren't running a Taj or a Marriott. They're running a 20 to 60 room independent property, or a boutique place someone's family has owned for two generations.
The read: independents hold most of the rooms but a minority of the online booking share and a shrinking share of the growth. That gap is exactly what's pulling branded chains and revenue-management providers into Tier 2–4 cities right now.
For the specific playbook, comp-set building and listing fixes independent hotels need, see MMR's Hotel Revenue Management guide.
Market-size estimates are named directly in the comparison table above: Mordor Intelligence, MarkNtel Advisors and Research and Markets. Occupancy, ADR and RevPAR figures come from HVS ANAROCK's India Hospitality Industry Overview 2025. Room counts and the organized-vs-unorganized split come from Hotelivate's Sizing Up Indian Hospitality report. Regional arrival figures (Uttar Pradesh, Kerala) are drawn from those states' own tourism department disclosures. The online-booking penetration, OTA-share and direct-channel CAGR figures reflect ongoing industry monitoring and have not been re-verified against a single named report in this latest pass, treat them as directionally accurate rather than freshly sourced. Portfolio-specific figures (843+ hotels managed, ₹452+ crore optimized, 36% average uplift, 2,243+ free audits) are MMR Hotel Benchmarking Data, drawn from MMR's own managed properties, not third-party research.
Why MMR Hotels
All of this data points to the same conclusion for hotel owners: the Indian hospitality market is moving fast, and the properties that win are the ones managing pricing, distribution and reputation like a discipline, not an afterthought handled between shifts. That's the gap MMR Hotels was built to close, and we'd rather show that with numbers than just say it.
A lot of revenue management software gets built for the US or European market and bolted onto India afterward. Festival demand curves, OTA rank algorithms on MakeMyTrip and Goibibo specifically, regional travel patterns that shift the moment a big wedding season or pilgrimage calendar hits: none of that transfers cleanly from a generic playbook. MMR started in Bhopal in 2018 building for exactly this market, and we're still one of very few teams we know of doing implementation week over week rather than handing over a quarterly PDF and calling it strategy.
Every number in this guide, the occupancy trends, the ADR benchmarks, the online-versus-offline split, is the kind of thing MMR's team tracks daily across an 843-property portfolio. If you want to know where your own hotel actually stands against it, that's what the audit below is for.
Where does your property actually sit against these numbers?
We'll benchmark your pricing, OTA performance and direct booking ratio against your real comp set, not a national average, in 48 hours, at no cost.
Book Free Revenue AuditAll Guides in This Pillar
Each guide covers a specific area in depth. Start with the ones most relevant to your current situation.