
What Is a Hotel Channel Mix?
Definition
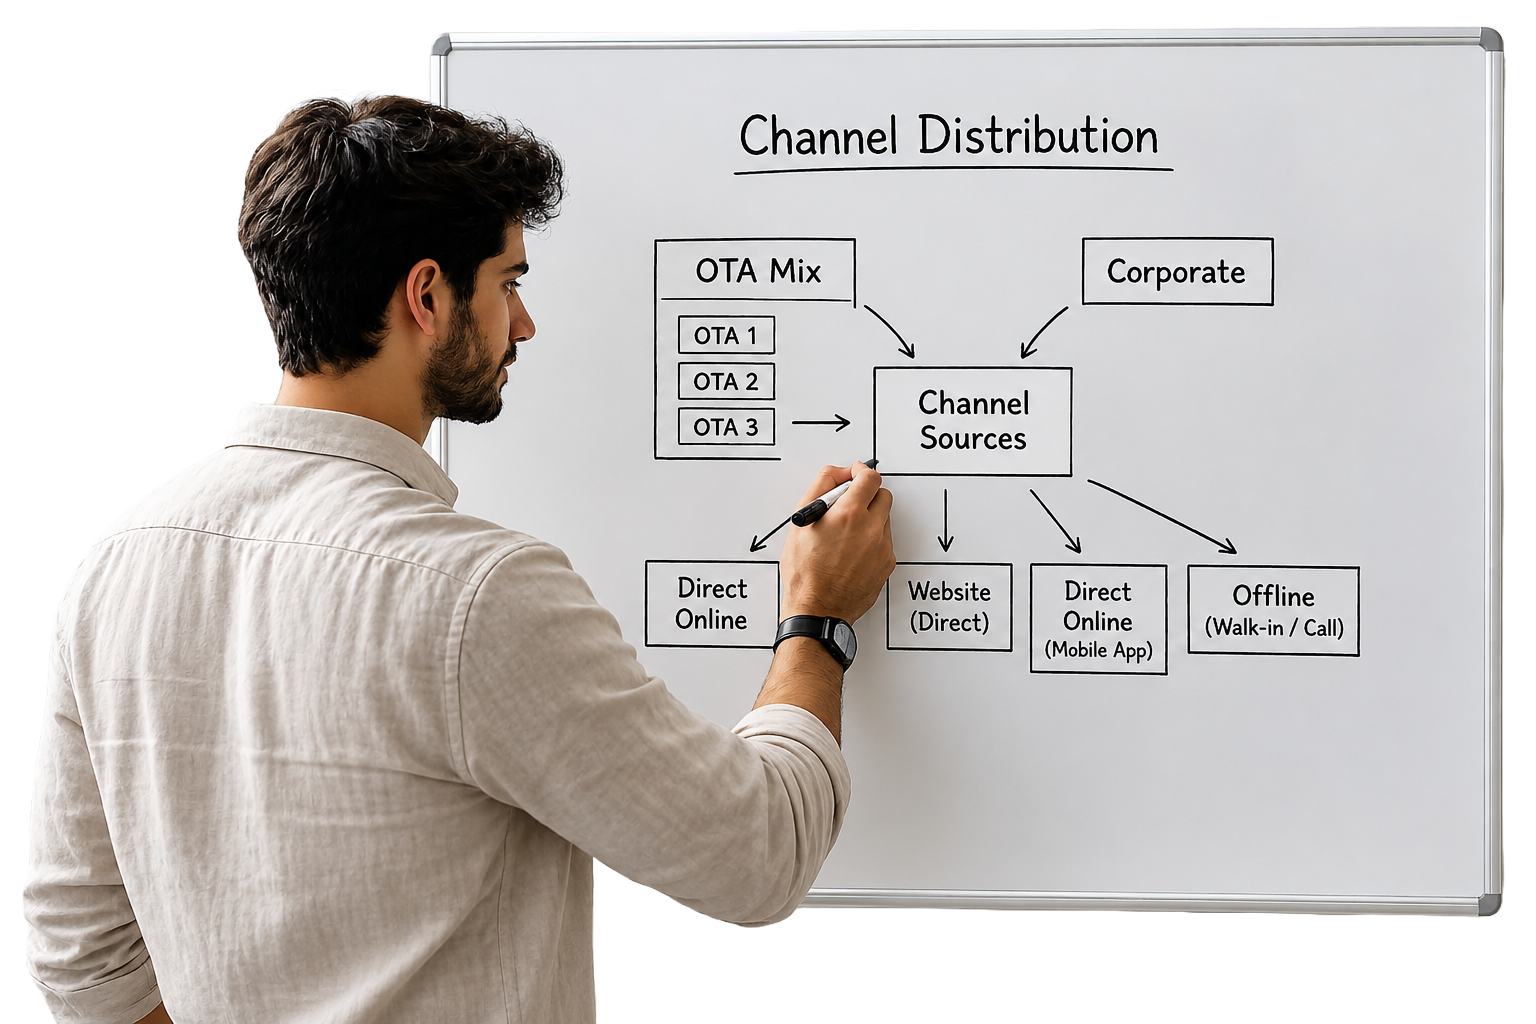
A hotel channel mix is the breakdown of where bookings come from. If a hotel receives 100 bookings in a month and 65 come from Booking.com, 20 from the hotel website, 10 from corporate accounts, and 5 from walk-ins, the channel mix is 65% OTA, 20% direct, 10% corporate, 5% walk-in. That mix determines the total commission paid, the data the hotel owns about its guests, and the average profit per booking.
Why Channel Mix Matters
Two hotels with identical occupancy and identical ADR can have very different net revenues depending on where their bookings come from. A booking through the hotel website costs roughly 2 to 5% in payment fees. The same booking through Booking.com costs 15 to 18% in commission. On a room rate of INR 4,000, that difference is between INR 80 and INR 720 per booking. Multiplied across hundreds of bookings per month, channel mix is one of the largest controllable revenue levers a hotel has.
Distribution vs Marketing
Distribution is how inventory is made available and sold. Marketing is how guests are attracted to choose that inventory. The two overlap but are not the same. OTAs handle both: they distribute inventory and market it to their user base. A direct booking strategy separates these: the hotel distributes through its own booking engine and markets through its own channels. Understanding this distinction matters because the cost structure of each approach is completely different.
Channel Mix vs Distribution Strategy
Channel mix is the current state: where bookings are coming from now. Distribution strategy is the intended state: where the hotel wants bookings to come from and what it will do to get there. Most hotels have a channel mix. Fewer have a distribution strategy. The difference is whether the mix is the result of deliberate decisions or just what happened by default.
Benefits of a Balanced Channel Mix
| Benefit | What It Means in Practice |
|---|---|
| Higher Profitability | Lower average commission paid per booking. Same revenue, more of it retained. |
| Lower Acquisition Cost | Direct bookings cost a fraction of OTA bookings. Even a 10% shift in mix improves margins. |
| Better Guest Ownership | Direct bookings give the hotel the guest's email and contact details. OTA bookings often don't. |
| Reduced Business Risk | A hotel dependent on one OTA is vulnerable to that platform's algorithm changes, commission increases, or policy shifts. |
| Improved Occupancy Stability | Multiple channels filling rooms at different lead times reduces the peaks and troughs of single-channel dependency. |
Understanding Hotel Booking Channels
Hotels receive bookings through more channels than most revenue teams actively track. Each channel has a different cost, a different guest profile, and a different level of operational complexity. Understanding what each one is and when it applies to a specific property type is the foundation of any distribution strategy.
| Channel | What It Is | Best For | Typical Cost |
|---|---|---|---|
| Direct Website | Bookings made through the hotel's own website via a booking engine | All property types with any brand presence or returning guests | 2–5% (payment gateway + booking engine) |
| OTAs | Booking.com, MakeMyTrip, Agoda, Goibibo, Expedia and similar platforms | New hotels, low brand awareness markets, international demand | 12–22% commission |
| GDS | Global Distribution Systems: Amadeus, Sabre, Galileo. Used by travel agents and corporate travel managers | Business hotels, airport hotels, properties with significant corporate or international travel agent demand | 15–20% + GDS fees |
| Corporate Accounts | Negotiated rates with companies whose employees stay regularly | City business hotels, properties near office districts or industrial areas | Low: primarily sales team time to acquire and manage |
| Travel Agents | Traditional travel agencies booking on behalf of clients | Leisure properties, heritage hotels, destinations where offline agents remain active | 10–15% commission |
| Tour Operators | Companies that package hotels with transport and activities | Resorts, leisure destinations, properties in tourist circuits | 20–30% discount off rack rate |
| Wholesalers | Intermediaries who buy rooms in bulk and resell through multiple channels | Large properties with surplus inventory in off-peak periods | 25–35% below net rate |
| Metasearch | Google Hotel Ads, Trivago, Kayak: aggregate rates from multiple sources | Properties with a direct booking engine and budget for paid visibility | Pay-per-click: variable, typically 8–15% effective cost |
| Walk-in Guests | Guests who arrive without a prior reservation | Budget hotels, highway properties, markets with low advance planning behaviour | Zero acquisition cost |
| Telephone Bookings | Reservations made directly by phone to the hotel | Any property with a reservations team; often corporate or older guest segments | Staff time only |
| Email Enquiries | Booking requests sent directly to the hotel by email | Groups, event bookings, long stays, corporate enquiries | Staff time only |
| Social Media | Instagram DMs, Facebook messages, WhatsApp enquiries routed to reservations | Boutique and lifestyle properties with an active social presence | Marketing spend + staff time |
| Referral Bookings | Bookings from affiliate sites, travel bloggers, or partner businesses | Properties with content marketing or partnership programmes | Referral fee typically 5–10% |
| Repeat Guests | Previous guests booking directly due to a positive prior experience | All property types: the highest-value channel for most hotels | Lowest of all channels: email or loyalty programme cost only |
The Hotel Distribution Ecosystem
These channels don't operate independently. They connect through a stack of technology systems that sit between a guest's search and the hotel's PMS. Understanding how the ecosystem fits together explains why changes in one part, a content score drop on Booking.com, a booking engine that loads slowly, a channel manager sync error, affect the whole distribution picture.
Guest Intent
The guest decides to travel and begins searching. This happens on Google, an OTA app, social media, or by going directly to a hotel website they already know. The channel they use first is influenced by brand awareness, past experience, and what the algorithm surfaces based on their search history.
Discovery Platform
The guest finds properties through Google Search, Google Hotel Ads, an OTA search results page, a travel agent recommendation, or a corporate booking tool. Each discovery platform has its own ranking logic and surfaces different properties based on different criteria.
Booking Platform
The guest completes the reservation on an OTA, through the hotel's direct booking engine, through a GDS terminal, or via a corporate booking tool. Each platform takes a different cut of the transaction and passes a different amount of guest data to the hotel.
Channel Manager
The channel manager receives the booking, deducts the inventory from all connected channels simultaneously, and passes the reservation to the PMS. If the channel manager integration is unreliable, double-bookings, availability errors, and rate discrepancies appear across platforms.
PMS and Hotel Operations
The PMS holds the confirmed reservation. The hotel team manages the stay. Post-stay, the PMS generates data that feeds back into revenue management decisions, guest CRM, and channel performance reporting. The quality of the data at this stage depends on how accurately the earlier steps were managed.
A weakness at any point in this chain affects performance everywhere else. A slow booking engine on the hotel website costs direct bookings. A channel manager sync error damages OTA ranking. A PMS that doesn't capture guest emails prevents repeat booking campaigns. Distribution performance is a system outcome, not a single-channel problem.
Why Hotels Become Overdependent on OTAs
OTA overdependence rarely happens by deliberate choice. It happens by default, through the accumulation of small decisions and inactions over time. Understanding why it happens is the first step to reversing it.
Easy Visibility
OTAs provide immediate visibility to a large audience with minimal effort. A new hotel can be live on Booking.com in 48 hours and receiving bookings within days. The direct alternative, building website traffic through SEO and paid advertising, takes months. For new hotels or those under pressure to fill rooms quickly, the OTA path is the obvious one. The problem is that it stays the obvious one permanently unless a deliberate effort is made to develop other channels.
Lack of Website Traffic
A hotel website that receives very little traffic cannot generate meaningful direct bookings regardless of how good the booking engine is. Most hotel websites in India receive fewer than 500 organic sessions per month. At a 3% conversion rate, that is 15 bookings per month maximum from direct. The OTA, by contrast, sends the listing to millions of active searchers. The traffic gap drives the booking gap.
Weak Marketing
Generating direct bookings requires active marketing: Google Hotel Ads, email campaigns to past guests, social media, SEO-optimised content. All of these require time, skill, and budget. Many independent hotels don't have the team capacity to run them properly, so OTA marketing fills the gap by default.
Poor Direct Booking Experience
If the hotel website is slow, outdated, or difficult to navigate on mobile, guests who land on it leave and book through an OTA instead. A guest who searches the hotel name on Google, clicks the website, waits five seconds for it to load, and then can't find the rates for their dates, will book through Booking.com in the next tab. The OTA wins not because it's cheaper but because it's easier.
No Loyalty Programme
OTA loyalty programmes, Booking.com Genius, MakeMyTrip's rewards scheme, give guests a reason to book through the platform repeatedly rather than direct. Without a competing direct incentive, guests who had a good stay have no particular reason to return via the hotel website. They go back to the platform where they found the hotel the first time.
Limited Brand Awareness
Guests who don't know the hotel's name search for "hotels in Pune near railway station" rather than the property name directly. OTAs capture this category-level search traffic. Brand-level search traffic, which leads to direct bookings, requires the hotel to have built sufficient recognition that guests search for it specifically. Most independent hotels haven't invested in the brand presence required for this.
The Pros and Cons of Every Booking Channel
No channel is uniformly good or bad. Each one makes sense in specific circumstances and becomes a problem when it dominates the mix beyond what the property's profitability can support.
| Channel | Reach | Cost | Guest Ownership | Cancellation Risk | Ease of Management | Best Use |
|---|---|---|---|---|---|---|
| Direct Website | Low unless traffic is built | 2–5% | Full: email, preferences, history | Low: non-refundable rates easier to enforce | Moderate: requires website and booking engine maintenance | Returning guests, brand-aware markets, loyalty programmes |
| OTAs | Very high | 12–22% | Limited: OTA controls guest data | High: flexible cancellation default | Easy: platform handles marketing and payment | New hotels, low brand awareness, international demand, filling gaps |
| GDS | High for corporate segment | 15–20% + fees | Moderate: company data available | Low: corporate bookings have stricter policies | Complex: requires GDS connectivity setup | Business hotels with significant corporate or travel agent demand |
| Corporate Accounts | Low: limited to contracted companies | Very low | High: direct relationship with company booker | Very low: corporate policy enforces completion | Moderate: requires sales team to acquire and manage contracts | City hotels near business districts with repeat corporate demand |
| Travel Agents | Moderate | 10–15% | Moderate | Low to moderate | Moderate | Leisure destinations, group travel, older demographics |
| Wholesalers | High in specific markets | 25–35% discount | None | Variable: depends on contract terms | Low: bulk allocation managed by contract | Large properties needing to move volume in off-peak periods |
| Walk-ins | Zero: guest initiates contact | Zero | Full | Zero | Very easy | Budget hotels, highway properties, high footfall locations |
The Ideal Hotel Channel Mix
There is no universal ideal channel mix. A 35-room heritage property in Udaipur should have a very different distribution strategy than a 150-room airport business hotel in Hyderabad. The right mix depends on property type, location, guest segment, brand maturity, and team capacity. The examples below show realistic target ranges rather than fixed formulas.
| Property Type | OTA Target | Direct Target | Corporate / GDS | Other | Key Priority |
|---|---|---|---|---|---|
| Luxury Hotel | 25–35% | 35–45% | 15–20% | 5–10% | Build direct through brand investment and loyalty |
| Budget Hotel | 55–70% | 15–25% | 5–10% | 5–15% | OTA dependency acceptable at this segment; focus on listing quality |
| Boutique Hotel | 35–50% | 30–40% | 5–10% | 10–15% | Build direct through content, social, and email |
| Resort | 40–55% | 25–35% | 5–15% | 10–15% | Tour operator and travel agent relationships matter here |
| Business Hotel | 35–50% | 20–30% | 20–30% | 5–10% | Corporate account development reduces OTA dependency profitably |
| Airport Hotel | 40–55% | 15–25% | 20–30% | 5–10% | GDS and corporate accounts are natural fits for transit demand |
| Serviced Apartment | 30–45% | 30–40% | 15–25% | 5–10% | Long-stay corporate accounts and direct relationships most valuable |
| Hostel | 60–75% | 15–20% | Near zero | 10–15% | OTA dominant in this segment; hostel-specific platforms also relevant |
Rather than asking "what percentage of bookings should come from OTAs," ask: "what is the maximum OTA share we can sustain while maintaining our target net revenue per available room?" The answer to that question, not an industry benchmark, should determine the channel mix target.
OTA vs Direct Bookings
The OTA vs direct debate often focuses on commission rates. The real comparison is broader. Each channel produces different outcomes across occupancy, profitability, guest relationship, and long-term business value.
| Factor | OTA Booking | Direct Booking |
|---|---|---|
| Occupancy Impact | High: OTAs drive volume, especially for properties without strong brand presence | Lower until direct traffic is built; then stable and predictable |
| Revenue | Gross revenue looks good; net revenue after commission is lower | Lower gross volume typically; higher net revenue per booking |
| Profit | Thinner margin: 12–22% commission reduces net significantly | Higher margin: 2–5% cost vs 15%+ OTA commission |
| Guest Relationship | Weak: OTA controls the pre-stay communication; hotel gets limited guest data | Strong: hotel communicates directly from booking confirmation onward |
| Lifetime Value | Low: repeat guests often rebook through the OTA, paying commission again each time | High: repeat direct bookers cost almost nothing to reacquire |
| Marketing Cost | Commission is the marketing cost. Simple and predictable. | Website, SEO, Google Hotel Ads, email. Higher upfront, lower per-booking at scale. |
| Data Ownership | None: guest email often masked or unavailable; booking preferences not shared | Full: email, room preferences, stay history available for remarketing |
Most hotels need both OTA and direct channels. OTAs fill demand that direct channels can't reach, particularly for new guests, international travellers, and last-minute searches. Direct channels serve returning guests, corporate accounts, and guests who know the property. A healthy mix uses OTAs for acquisition and direct channels for retention. Trying to replace OTA volume with direct before the traffic infrastructure is in place creates occupancy gaps, not savings.
Understanding Distribution Costs
Every booking has a cost. The cost varies by channel, and it is not always immediately visible. OTA commission appears as a line item on the monthly statement. Website marketing costs are spread across multiple budget lines. Understanding the true cost of each channel is what makes channel mix decisions financially informed rather than intuitive.
| Cost Type | Channel | Typical Range | How It's Charged |
|---|---|---|---|
| OTA Commission | Booking.com, MakeMyTrip, Agoda, Expedia | 12–22% of booking value | Deducted from monthly settlement or invoiced separately |
| GDS Fees | Amadeus, Sabre, Galileo | 15–20% commission + USD 3–6 per booking transaction fee | Per-booking charge plus monthly connectivity fee |
| Booking Engine Cost | Direct website | INR 1,500–8,000 per month or 1–2% per booking | Monthly SaaS fee or per-booking percentage |
| Payment Gateway Fees | Direct website, telephone bookings | 1.5–3% of transaction value | Per-transaction percentage charged by payment processor |
| Google Hotel Ads | Metasearch direct | 8–15% effective cost per booking | Pay-per-click; cost per booking depends on conversion rate |
| Loyalty Programme | Direct repeat bookings | 3–7% of booking value in points or rewards | Accrued as points liability; redeemed at future stays |
| Sales Team Cost | Corporate accounts, groups, travel agents | Variable: salesperson cost allocated per booking acquired | Fixed salary + incentives divided by bookings generated |
| Channel Manager Fee | All OTA-connected channels | INR 2,000–12,000 per month depending on number of channels | Monthly subscription; shared across all connected channels |
The cost of acquiring a direct booking through a well-run Google Hotel Ads campaign is typically 8 to 12%, which is lower than most OTA commissions. However, this assumes a functioning booking engine, a well-built campaign, and enough traffic to make the economics work. At low volumes, the fixed costs of a direct booking programme can make it more expensive per booking than OTA commission until sufficient scale is reached.
Calculate Your Cost of Acquisition
Cost of acquisition (CPA) is the total cost of generating one confirmed booking from a specific channel. Calculating it accurately is what turns channel mix from a general principle into a specific financial decision.
Cost Per Booking = Total Channel Cost ÷ Number of Bookings from That Channel Example: If the hotel paid INR 1,80,000 in OTA commission in a month and received 60 OTA bookings, the cost per booking is INR 3,000.
Net Revenue = Gross Booking Value × (1 − Commission Rate) Example: A booking of INR 5,000 at 18% commission produces net revenue of INR 5,000 × 0.82 = INR 4,100.
CAC = Total Marketing + Distribution Spend ÷ Total Bookings Generated Include all costs: commission, advertising spend, booking engine fees, payment gateway fees, and a proportion of the sales team cost if applicable.
Contribution Margin = Net Revenue − Variable Operating Costs Variable costs include housekeeping, laundry, F&B if included, and any guest amenity costs. Fixed costs like staff and utilities are excluded from channel-level contribution margin calculations.
| Channel | Gross Rate (INR) | Acquisition Cost | Net Revenue (INR) | Contribution Margin |
|---|---|---|---|---|
| Booking.com | 5,000 | 18% = 900 | 4,100 | Lower |
| Direct Website | 5,000 | 4% = 200 | 4,800 | Higher by INR 700 vs Booking.com |
| Google Hotel Ads | 5,000 | 10% = 500 | 4,500 | Between OTA and pure direct |
| Corporate Account | 4,200 (negotiated rate) | 2% = 84 | 4,116 | Comparable to OTA despite lower rate due to near-zero acquisition cost |
| Walk-in | 5,500 (rack rate) | 0 | 5,500 | Highest of all channels |
Building a Healthy Channel Mix Strategy
Building a better channel mix is not a one-month project. It is a structured process that starts with understanding the current state and makes targeted improvements over six to twelve months. The steps below are sequential: completing each one properly before moving to the next produces more reliable results than attempting all of them simultaneously.
Audit Current Booking Sources
Pull the last three months of booking data by channel from the PMS. Calculate what percentage of total bookings and total revenue came from each source. Calculate the commission or acquisition cost paid per channel. This is the baseline from which all improvement is measured. Most hotels discover at this stage that their OTA dependency is higher than they thought and their direct booking cost is higher or lower than expected.
Measure Acquisition Costs
Calculate the true cost per booking for each channel using the formulas in Section 9. Include all costs: commission, advertising, booking engine fees, and a pro-rata share of any staff time dedicated to managing that channel. This step often produces surprises. A corporate account that looked like a low-rate channel sometimes turns out to be more profitable per booking than an OTA booking at rack rate once commission is removed.
Identify High-Profit Channels
Rank channels by contribution margin, not by booking volume or gross revenue. The channels that produce the highest net revenue per booking are the ones worth investing in to grow. For most hotels, the top two or three by profitability are walk-in guests, repeat direct bookers, and corporate accounts. The channels with the lowest contribution margin are usually OTAs and wholesalers.
Reduce OTA Dependency
Set a realistic target for reducing OTA share by 5 to 10 percentage points over the next twelve months. Identify which channel will replace that volume: direct website, corporate accounts, or both. Do not reduce OTA inventory allocation until the replacement channel is generating bookings at sufficient volume to cover the shortfall. Cutting OTA exposure before the alternative is working creates occupancy gaps, not savings.
Increase Direct Demand
The specific tactics depend on the property type and team capacity. The highest-return options for most Indian hotels: a Google Hotel Ads campaign connected to a fast booking engine, an email re-engagement campaign to past guests, and a best-rate guarantee that gives guests a reason to book direct rather than through an OTA. Section 11 covers each tactic in detail.
Monitor Monthly
Review booking source breakdown, acquisition costs, and channel contribution margin once per month. Compare against the prior month and the same month last year. A channel mix strategy that is reviewed annually is a strategy that drifts. Monthly monitoring catches shifts before they compound into structural problems.
Strategies to Increase Direct Bookings
Increasing direct bookings requires addressing the two reasons guests book through OTAs instead: the OTA is easier to find, and the OTA is easier to book through. The strategies below address both. None of them work in isolation. The ones that produce the highest return for most Indian hotels are listed first.
| Strategy | What It Does | Time to Impact | Investment Level |
|---|---|---|---|
| Hotel Website Optimisation | Fast, mobile-friendly website with a working booking engine. The foundation without which nothing else converts. | Immediate on launch | One-time build cost |
| Best Rate Guarantee | Visible commitment that the hotel website will always match or beat any OTA price. Removes the guest's main reason to check OTAs instead of booking direct. | Immediate | Zero cost; requires rate parity management |
| Google Hotel Ads | Puts the hotel's direct booking rate next to OTA rates in Google search results. Guests comparing prices see the direct option at the moment of decision. | 2–4 weeks to set up | Pay-per-click; budget flexible |
| SEO | Organic search visibility for hotel name and destination searches. Slow to build, high return once established. | 6–12 months | Content and technical investment |
| Email Marketing | Re-engagement campaigns to past guests who booked direct previously. The highest-ROI direct booking tactic for hotels with a usable guest database. | First campaign within 2 weeks | Low: email platform cost only |
| WhatsApp Reservations | Reservation enquiries and confirmations via WhatsApp. Particularly effective in India where WhatsApp is the dominant messaging platform. | Immediate | Very low: staff time to manage |
| Loyalty Programme | Points or benefits for guests who book direct. Incentivises repeat direct bookings from guests who have already stayed. | 3–6 months to see repeat booking impact | Moderate: programme setup and reward cost |
| Content Marketing | Blog posts, destination guides, and local experience content that attract organic search traffic and build brand awareness. | 6–18 months | Moderate: content production cost |
| Repeat Guest Campaigns | Targeted offers to guests who previously stayed, timed around anniversary dates, upcoming local events, or seasonal peaks relevant to their previous trip. | First campaign within 1 month | Low |
| Social Media | Brand-building and community content that creates familiarity before the booking search begins. Supports conversion rather than driving it directly. | Long-term brand building | Staff time + content production |
When OTA Bookings Are Good for Business
OTAs are not the enemy of profitability. Used strategically, they serve specific purposes that no other channel handles as efficiently. The goal is not to eliminate OTA bookings but to use them where they add value and reduce dependence where they don't.
A hotel with no brand presence and no guest database has no direct booking channel to rely on. OTAs provide immediate visibility and bookings from day one. The strategy is to use OTA volume during the launch period to build review score, collect guest data where permitted, and fund the investment in direct booking infrastructure in parallel.
When rooms are going unfilled, an OTA booking at 18% commission is better than an empty room at 0% revenue. OTA promotions and last-minute deals are effective tools for filling gap nights that direct channels haven't filled, provided the net rate still covers variable costs.
OTAs aggregate demand from a much larger audience than most hotel direct channels reach. During off-season periods when the hotel's own marketing audience is smaller, OTA visibility to new guest segments can fill rooms that would otherwise go empty.
Reaching international guests requires platforms they actually use. An Indian hotel trying to attract European or Southeast Asian guests without Booking.com or Agoda is invisible to most of that audience. OTAs are the most cost-effective international distribution channel for independent hotels.
Rooms that reach the 48-72 hour window unsold benefit from OTA last-minute deals programmes. The commission on a last-minute booking that would otherwise be zero revenue is almost always worth paying.
When Too Many OTA Bookings Become a Problem
When 65 to 70% of all bookings carry a 15 to 18% commission, the cumulative effect on profitability is significant. A hotel running INR 50 lakhs per month in room revenue with 70% OTA share is paying INR 5.25 to 6.3 lakhs per month in OTA commission alone. Shifting 10 percentage points of that to direct saves INR 75,000 to 90,000 per month without changing a single rate.
OTA parity clauses restrict the hotel's ability to offer lower rates on its own website or to specific guest segments. This limits pricing flexibility and makes it harder to build a compelling direct booking proposition. The constraints vary by platform and evolve with regulation, but they are a genuine operational friction for high-OTA-dependency properties.
An OTA guest is the OTA's guest first. The hotel rarely gets the guest's email before arrival, often can't contact them outside the OTA messaging system pre-stay, and has no guaranteed way to market to them after checkout. A hotel that has generated thousands of bookings over three years but built no direct guest database has no real customer base, just a history of transactions.
A hotel generating 70% of revenue from one OTA is exposed to every decision that platform makes: algorithm changes, commission increases, programme requirement changes, or ranking policy shifts. This is not a theoretical risk. OTAs have changed commission structures, introduced mandatory programme participation, and altered ranking criteria with limited notice. Diversification is risk management.
Seasonal Channel Mix Strategies
The right channel balance shifts across the year. A distribution strategy that works in peak season often underperforms in shoulder season because the demand profile, lead time, and guest segment are different. Adjusting channel mix by season is a proactive revenue management action, not a reactive one.
| Period | Demand Character | Channel Priority | Key Action |
|---|---|---|---|
| Peak Season | High demand, long lead times, rate-tolerant guests | Direct first, OTA to fill remaining capacity | Open direct booking window early; use OTA last-room-available strategy |
| Shoulder Season | Moderate demand, mixed lead times, price-sensitive guests | Balanced: direct and OTA equally | OTA promotions for short lead times; direct offers to past guests for longer lead times |
| Low Season | Low demand, short lead times, heavy price sensitivity | OTA dominant with aggressive promotions | Last-minute deals, Genius or equivalent programme, corporate accounts to supplement |
| Festival Periods | Compressed demand window, high search volume, early planning | Direct priority, OTA for international and unknown demand | Load festival-period promotions on direct channel first; restrict OTA availability if direct fills |
| Citywide Events | Event-driven demand spike, international mix, atypical lead times | OTA for international; direct for known corporate demand linked to the event | Tag event venue in OTA listing; ensure availability loaded for event dates 60+ days out |
| Weekday vs Weekend | Business demand weekdays; leisure demand weekends (city hotels) | Corporate and direct weekdays; OTA and leisure weekends | Separate rate plans by day of week; corporate rates for Mon–Thu, leisure OTA for Fri–Sun |
Market Segment-Based Channel Mix
Different guest segments use different booking channels habitually. Building a channel mix that matches the segments the hotel is targeting is more effective than a uniform approach across all demand types.
| Segment | Preferred Booking Channel | Typical Lead Time | Distribution Priority |
|---|---|---|---|
| Leisure | OTA (MakeMyTrip, Booking.com), metasearch, social media referrals | 2–8 weeks | OTA listing quality, seasonal promotions, social media presence |
| Corporate | Corporate booking tools, GDS, direct negotiated rate | 1–7 days | GDS presence, direct corporate contracts, business amenity tagging |
| Groups | Direct email or phone, travel agent, tour operator | 1–6 months | Direct sales team, group inquiry response speed, block allocation management |
| Weddings | Direct referral, wedding portals, social media | 3–12 months | Direct relationship with event planners, website visibility for wedding searches |
| MICE | GDS, direct corporate, specialised MICE platforms | 1–6 months | Meeting room specification on listing, GDS connectivity, direct MICE sales |
| Long Stay | Direct, corporate, Airbnb for serviced apartments | 1–4 weeks | Weekly and monthly rate plans, direct inquiry handling, Airbnb for applicable properties |
| International | Booking.com, Agoda, Expedia, international travel agents | 2–12 weeks | OTA listings in relevant languages, Agoda for Asian markets, Expedia for Western |
| Domestic | MakeMyTrip, Goibibo, direct website, WhatsApp | 1–4 weeks | MakeMyTrip and Goibibo listing quality, WhatsApp reservation capability, email marketing to past guests |
Technology That Supports Channel Mix
Managing multiple booking channels without the right technology stack creates errors, inefficiencies, and missed opportunities. Each tool in the stack handles a different part of the distribution process. The goal is a connected system where a change in one place flows correctly to all others.
| Tool | What It Does for Channel Mix | When You Need It | Guide |
|---|---|---|---|
| PMS | Central reservation record. All channel bookings flow into the PMS. Source-of-business reporting shows channel mix data. | Every property | |
| Channel Manager | Synchronises rates and availability to all connected OTAs in real time. Prevents double-bookings. Enables inventory allocation by channel. | Any hotel active on two or more OTAs | Channel Manager Guide |
| Booking Engine | The direct booking infrastructure on the hotel website. Receives reservations without OTA involvement and feeds them into the PMS. | Any hotel with a website and a direct booking strategy | Booking Engine Guide |
| CRS | Central Reservation System. Manages rates, availability, and inventory across all channels from a single interface. More sophisticated than a channel manager alone. | Multi-property groups or hotels with complex rate structures | |
| Revenue Management System | Recommends or automates rate decisions by channel based on demand forecasts. Supports channel-specific pricing strategies. | 50+ room properties with significant demand variation | |
| CRM | Stores guest data from direct bookings. Enables email marketing, repeat guest campaigns, and loyalty programme management. | Any hotel with a direct booking programme and a guest database worth marketing to | |
| Marketing Automation | Automates email sequences, post-stay review requests, re-engagement campaigns, and loyalty communications. | Hotels with sufficient direct booking volume to justify the setup and ongoing management |
KPIs to Measure Channel Performance
Channel mix decisions should be driven by data. The KPIs below give a complete view of how each channel is performing: volume, revenue, cost, and quality of booking.
| KPI | What It Measures | How to Calculate | Review Frequency |
|---|---|---|---|
| Channel Contribution % | What percentage of total bookings and revenue each channel produces | Channel bookings ÷ Total bookings × 100 | Monthly |
| ADR by Channel | Average daily rate from each booking source | Channel room revenue ÷ Channel rooms sold | Monthly |
| Net RevPAR by Channel | RevPAR after deducting acquisition cost. The truest measure of channel profitability. | (Channel RevPAR × (1 − Acquisition cost rate)) | Monthly |
| Cost of Acquisition | Total cost to generate one booking from each channel | Total channel cost ÷ Channel bookings | Monthly |
| Conversion Rate | For direct: website visitors who complete a booking. For OTAs: listing views that convert. | Bookings ÷ Sessions or listing views × 100 | Weekly |
| Cancellation Rate by Channel | Percentage of bookings from each channel that are cancelled | Cancelled bookings ÷ Total bookings per channel × 100 | Weekly |
| Repeat Guest Ratio | Percentage of guests who have stayed before | Returning guests ÷ Total guests × 100 | Monthly |
| Direct Booking Share | What percentage of all bookings came directly, without an OTA intermediary | Direct bookings ÷ Total bookings × 100 | Monthly |
| OTA Dependency Ratio | Opposite of direct share; tracks vulnerability to OTA disruption | OTA bookings ÷ Total bookings × 100 | Monthly |
Monthly Channel Mix Audit
Channel mix should be reviewed on a fixed monthly schedule. Without a structured process, distribution strategy drifts. OTA share creeps up, direct booking costs rise, and the shift only becomes visible when margins deteriorate enough to trigger concern. A monthly audit takes about 60 minutes and catches these shifts before they compound.
- 1 Booking Source ChangesCompare this month's channel contribution percentages against last month and the same month last year. Note any channel that has grown or shrunk by more than 5 percentage points.
- 2 Commission CostsCalculate total OTA commission paid this month. Compare against last month. Note if commission as a percentage of total room revenue has increased.
- 3 Net Revenue ContributionCalculate net revenue after acquisition cost per channel. Rank channels by net contribution. Note any channel where the ranking has changed significantly.
- 4 Occupancy ContributionWhat percentage of occupied room nights did each channel fill? A channel that contributes 30% of revenue but only 15% of occupied nights is producing high-rate bookings. The reverse signals a high-volume, low-rate channel.
- 5 Direct Booking GrowthIs the direct booking share increasing, stable, or decreasing versus the prior three months? If decreasing, identify whether the cause is a drop in website traffic, a conversion rate issue, or a pricing issue.
- 6 Website PerformanceCheck direct booking engine sessions, booking start rate, and abandonment rate. A high session count with low bookings indicates a conversion problem on the website. A low session count indicates a traffic problem.
- 7 One Action ItemIdentify one specific change to make before next month's audit: a new corporate account to target, a promotion to activate on a specific channel, a website fix, or a rate adjustment on an underperforming OTA.
Common Channel Mix Mistakes
| Mistake | What It Looks Like | What It Costs | Fix |
|---|---|---|---|
| Relying on one OTA | 70%+ of bookings from a single platform. Any algorithm or policy change by that platform is a business crisis. | Full exposure to one platform's decisions. No ability to negotiate or respond to commission increases. | Distribute across at least three OTAs. Build direct booking capacity in parallel. |
| Ignoring direct bookings | No working booking engine. No past guest database. No Google Hotel Ads presence. | Maximum OTA commission on every booking. No guest data ownership. No repeat booking capability. | Install a booking engine. Run Google Hotel Ads. Start collecting guest emails from direct bookings. |
| Measuring occupancy not profitability | Celebrating high occupancy while paying 18% commission on every room night. | Full rooms, thin margins. A hotel at 90% OTA occupancy may be less profitable than one at 75% with a better channel mix. | Track Net RevPAR by channel. Make decisions based on net revenue, not gross occupancy. |
| Poor rate management | Same rate on all channels regardless of demand. No differential for lead time or channel. | Leaves revenue on the table during high demand. Fails to use OTA promotions strategically during low demand. | Apply channel-specific and demand-responsive pricing. Use OTA promotions for gap nights only. |
| No performance reviews | Channel mix decided once and never revisited. OTA share drifts upward without being noticed. | Gradual margin erosion that only becomes visible after significant damage. | Monthly channel mix audit using the framework in Section 17. |
| Weak website experience | Slow website, non-mobile-friendly booking engine, rates not displayed clearly. | Guests who land on the website leave and book through an OTA. Direct investment is wasted. | Fix the booking engine first before investing in driving traffic to it. |
| Outdated distribution strategy | Same OTA mix and direct booking approach used for three or more years without review. | Misses new channels, new tools, and changing guest booking behaviour. | Annual distribution strategy review. Benchmark against what comparable properties are doing. |
Advanced Distribution Strategies
Dynamic Channel Allocation
Dynamic channel allocation means adjusting how much inventory is available on each channel based on current demand signals. During high-demand periods, reducing OTA availability and prioritising direct bookings captures the same revenue at lower acquisition cost. During low-demand periods, opening full OTA availability with promotional rates fills rooms that would otherwise go empty. A channel manager with allocation controls makes this manageable without manual intervention on each platform.
Channel-Based Pricing
Not all channels need to receive the same rate. Corporate rates are lower than rack but carry near-zero acquisition cost. Direct website rates can be matched to OTA rates while offering non-rate benefits like free breakfast or room upgrades that justify booking direct without violating parity clauses. Wholesale and tour operator rates are heavily discounted but paid in advance, removing cancellation risk. Each channel's rate should be set to produce the best net revenue given its cost structure and guest profile.
Closed-to-Arrival Strategy
Closing specific channels to new arrivals on high-demand dates forces guests to book further in advance or through preferred channels. A hotel sold out on a Friday through OTAs by Wednesday has left direct booking revenue on the table. Closing OTA arrival on peak dates earlier in the booking window while keeping direct booking open captures that demand at lower cost.
Inventory Allocation
Not every room type needs to be available on every channel. Allocating premium room categories only to direct and corporate channels while giving standard rooms to OTAs drives upsell revenue through lower-cost channels. This approach requires a channel manager that supports room-type-level allocation and pricing.
Corporate Contract Optimisation
Corporate contracts negotiated annually often use rates that were set in a different market environment. Reviewing corporate contract rates against current OTA rates and demand patterns annually ensures the hotel isn't providing below-market rates to corporate accounts that would pay more through an OTA. Conversely, well-structured corporate contracts with flexible volume commitments provide guaranteed occupancy at acceptable margins during low-demand periods.
AI-Assisted Distribution
Revenue management systems with AI capabilities increasingly make channel allocation and pricing recommendations based on historical patterns, forward-looking demand signals, and competitor rate data. These recommendations are most useful when reviewed and adjusted by a revenue manager who understands the property's specific context, rather than implemented automatically without oversight.
Hotel Channel Mix Checklist
Review booking sources by volume, revenue, and acquisition cost. Measure commission paid as a percentage of total room revenue. Track direct booking share versus prior month. Check website booking engine conversion rate. Confirm channel manager is syncing rates and availability correctly across all active platforms. Review cancellation rate by channel. Identify one improvement action for the next 30 days.
Recalculate net revenue and contribution margin per channel. Compare ADR and Net RevPAR across all channels. Review OTA dependency ratio trend over the past three months. Assess corporate account pipeline: any new accounts to target or existing contracts to renegotiate. Benchmark website performance: sessions, conversion rate, abandonment rate. Review Google Hotel Ads performance and budget allocation. Update seasonal rate plans on all channels for the next quarter.
Review full-year channel mix versus target ratios. Assess whether the target ratios themselves still make sense given market changes. Review all OTA programme participation: Genius, Preferred Partner, Agoda PointsMAX. Review all corporate account contracts against current market rates. Evaluate technology stack: is the booking engine, channel manager, and CRM still the right fit for current volume and strategy? Set channel mix targets for the next 12 months with measurable milestones.
Frequently Asked Questions
Want this set up for your property?
We'll review this against your hotel's current setup, free of charge.