The instinct when revenue is soft is to fill more rooms. Run a promotion, lower the rate, join a new programme, get more bookings. That sometimes works. It also sometimes produces 85% occupancy at margins that leave the owner wondering why the bank account doesn't reflect the full house. Occupancy is one input to revenue. Rate and distribution cost are the other two, and they receive far less attention in most properties than they deserve.
The Three Levers: Occupancy, Rate, and Distribution Cost
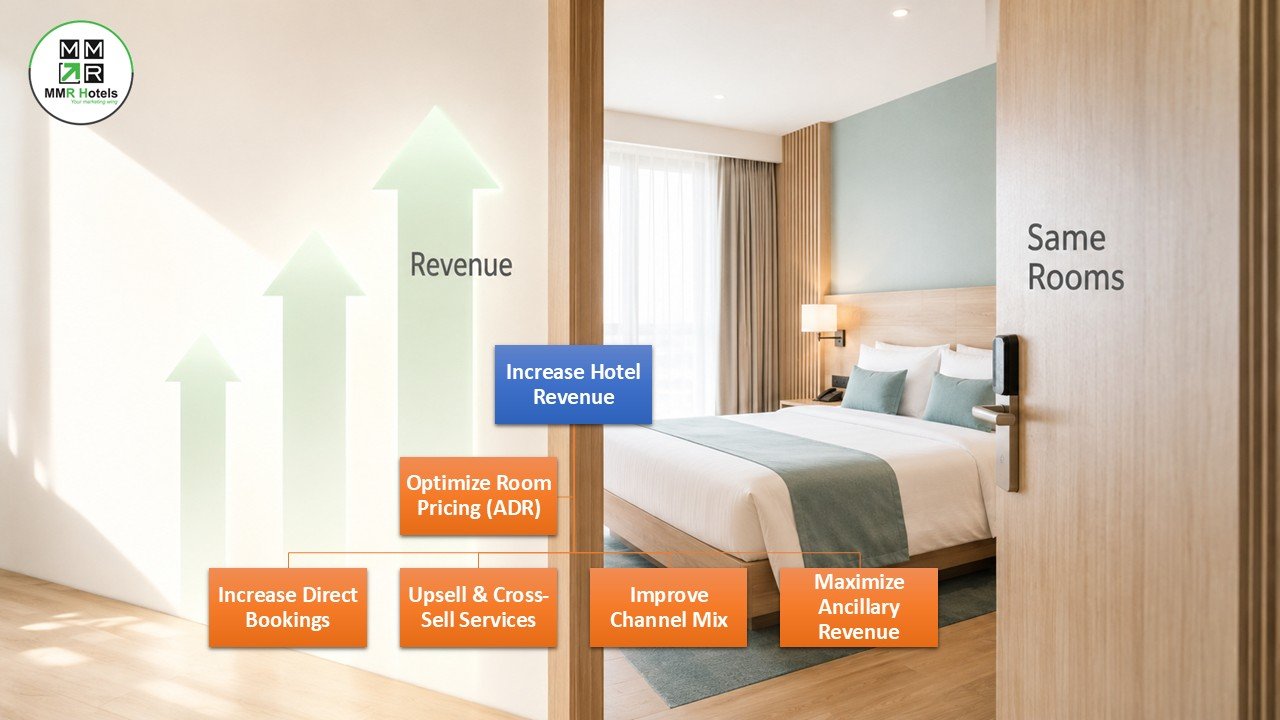
Hotel revenue is a product of three variables. How many rooms sold. What rate they sold at. And how much it cost to acquire each booking. Improving on any one of the three improves revenue. Improving on two produces compound results. The mistake most hotels make is focusing entirely on occupancy while letting rate drift downward and distribution cost drift upward through unchecked OTA programme participation.
| Lever | What It Controls | Most Common Mistake | High-Return Fix |
|---|---|---|---|
| Occupancy | How many rooms are sold | Cutting rate to fill rooms without checking whether RevPAR actually improves | Open availability fully. Fix OTA listing completeness. Manage restrictions. |
| Rate | What each room sells for | Static pricing that doesn't respond to demand signals or comp set movements | Weekly rate review against comp set. Dynamic pricing on high-demand dates. |
| Distribution Cost | What each booking costs to acquire | All bookings through OTAs at 15 to 20% commission with no direct channel development | Google Hotel Ads on brand keywords. Post-stay communication driving repeat direct. |
Dynamic Pricing: Rate That Responds to Demand
Dynamic pricing does not require a revenue management system. At its most basic, it means looking at what comparable properties are charging for the same dates and making sure your rate is defensible relative to them. A property that sets rates in January and reviews them in April is not managing revenue. It is managing a price list.
In practice, weekly is the minimum review frequency. For competitive markets and high-demand periods, twice weekly is better. The specific inputs to review: what your comp set is charging for the next 30 days, how your pickup pace this year compares to the same dates last year, and whether any demand events (local festivals, school holiday windows, conferences) are approaching that haven't yet been reflected in the rate calendar.
Once a week: log into the two or three OTAs where most of your bookings come from. Search for your destination and find your property in the results. Note what the four or five closest comparable properties are charging for the next two Fridays and the next midweek period. If you are more than 15% above or below the average without a clear quality justification, adjust. This takes 30 minutes and captures most of the rate optimisation opportunity available without any software investment.
Direct Bookings: The Highest Net Revenue Channel
A room sold directly produces 15 to 20% more net revenue than the same room sold through an OTA, because no commission is paid. A hotel converting even a modest share of OTA bookings to direct over 12 months produces meaningful additional retained revenue with no change in occupancy or gross rate.
The practical entry point for most properties: claim and complete the Google Business Profile, activate Google Hotel Ads on the hotel's brand name (cost per click is low, conversion is high), and set up a post-stay email or WhatsApp that invites past OTA guests to book direct next time. These three actions together can shift 5 to 10 percentage points of bookings from OTA to direct within 6 to 12 months for a property starting from zero direct booking infrastructure.
Ancillary Revenue: The Room Rate Is the Floor
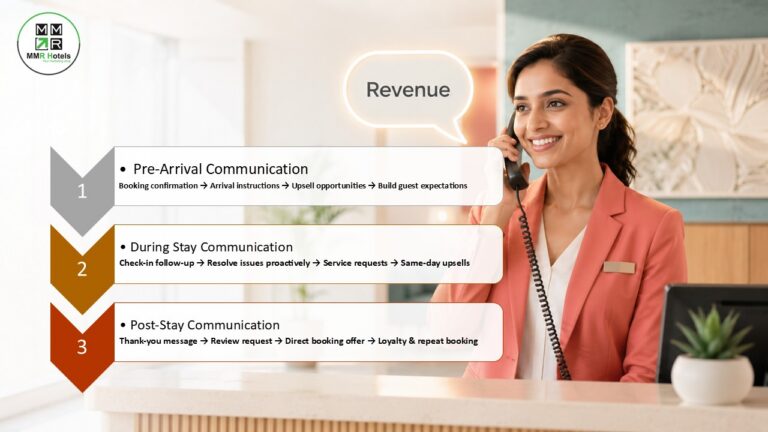
For full-service properties, increasing revenue from non-room departments is often more financially efficient than improving room rate. A room upgrade offer sent via WhatsApp 3 days before arrival converts at 8 to 15%. A spa treatment booking prompted by a specific pre-arrival offer adds revenue with near-zero marketing cost. A dinner reservation confirmed before check-in converts a guest who might otherwise have eaten elsewhere.
These are not large transactions individually. But a property generating INR 800 more per occupied room in ancillary revenue on 60% of its bookings at 70% occupancy across 40 rooms produces a meaningful annual revenue line from communication that costs the team 5 to 10 minutes per booking.
Review Score and Pricing Power
A higher review score is not just a reputation asset. It is a pricing asset. Hotels with scores above 4.5 on Google and 8.5 on Booking.com can sustain rates 10 to 15% above comparable lower-scored properties in the same market without proportional occupancy loss, because guests trust the quality signal and become less price-sensitive.
The investment required to improve review score is mostly operational: fixing the housekeeping issue mentioned repeatedly in low-rated reviews, upgrading WiFi reliability, training the front desk team on check-in experience. These are not large capital expenditures. They are process improvements that raise the experience quality that produces better reviews, which supports higher ADR, which compounds into better RevPAR over time.
Run this sequence before trying anything else. First, check OTA listing completeness: content score below 85% is the most common silent drag on bookings. Second, compare your rates against the comp set for the next 30 days. Third, check whether Google Hotel Ads is active showing your direct rate. Fourth, send a post-stay message to the last 20 guests asking them to book directly next time. The combined effect of these four actions costs almost nothing and typically produces visible improvement within 60 days.